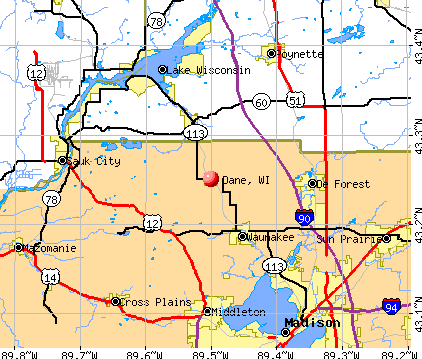
Dane, Wisconsin
Submit your own pictures of this village and show them to the world
- OSM Map
- General Map
- Google Map
- MSN Map
Population change since 2000: +35.7%
| Males: 613 | |
| Females: 471 |
| Median resident age: | 34.6 years |
| Wisconsin median age: | 40.4 years |
Zip codes: 53529.
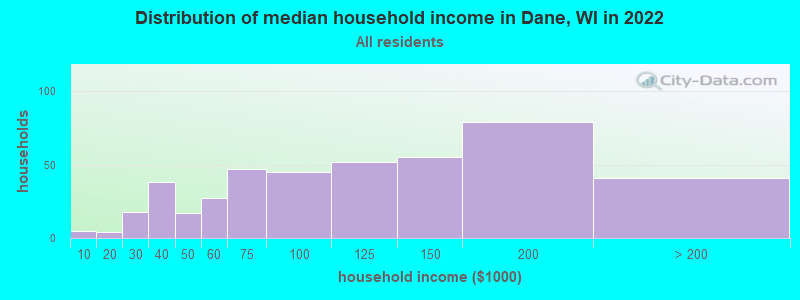
| Dane: | $102,646 |
| WI: | $70,996 |
Estimated per capita income in 2022: $43,144 (it was $18,533 in 2000)
Dane village income, earnings, and wages data
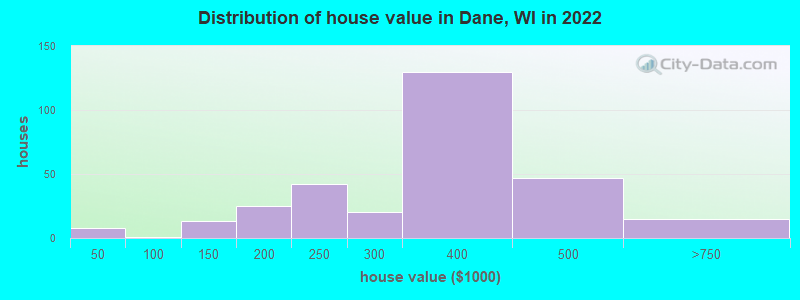
Estimated median house or condo value in 2022: $343,001 (it was $127,000 in 2000)
| Dane: | $343,001 |
| WI: | $252,800 |
Mean prices in 2022: all housing units: $411,151; detached houses: $438,642; townhouses or other attached units: $279,342; in 2-unit structures: $335,997; in 3-to-4-unit structures: $260,203; in 5-or-more-unit structures: $281,289; mobile homes: $129,987
Median gross rent in 2022: $1,174.
(4.8% for White Non-Hispanic residents, 40.0% for Black residents, 33.3% for Hispanic or Latino residents)
Detailed information about poverty and poor residents in Dane, WI
Compare current foreclosures near Dane, WI:
| Photo | Address | Area | Beds / Baths | Price | Details |
|---|---|---|---|---|---|

|
#1
Tarragon Dr
Madison, WI 53716
|
1,444 sq. feet
|
2 baths 4 beds |
show details | |

|
#2
School St
Merrimac, WI 53561
|
1,812 sq. feet
|
1 baths 3 beds |
show details | |

|
#3
Hollywood Dr
Madison, WI 53713
|
- sq. feet
|
- baths - beds |
show details | |

|
#4
S County Line Rd
Lodi, WI 53555
|
- sq. feet
|
- baths - beds |
show details | |

|
#5
E Washington Ave # 400
Madison, WI 53703
|
- sq. feet
|
- baths - beds |
show details | |

|
#6
Effingham Way Apt 216
Sun Prairie, WI 53590
|
- sq. feet
|
- baths - beds |
show details | |

|
#7
1/2 Williamson St, Apt 3
Madison, WI 53703
|
- sq. feet
|
- baths - beds |
show details | |

|
#8
W Mifflin St Unit 6140
Madison, WI 53703
|
- sq. feet
|
- baths - beds |
show details | |

|
#9
Don Simon Dr
Sun Prairie, WI 53590
|
- sq. feet
|
- baths - beds |
show details | |

|
#10
Midnight Pass, Apt 112
Verona, WI 53593
|
- sq. feet
|
- baths - beds |
show details |
| Photo | Address | Area | Beds / Baths | Price | Details |
|---|---|---|---|---|---|

|
#11
W Washington Ave # 500a
Madison, WI 53703
|
- sq. feet
|
- baths - beds |
show details | |

|
#12
Old Camden Sq Apt 202
Madison, WI 53718
|
- sq. feet
|
- baths - beds |
show details | |

|
#13
Leopold Way Apt 303
Sun Prairie, WI 53590
|
- sq. feet
|
- baths - beds |
show details | |

|
#14
Walmar Dr
Sun Prairie, WI 53590
|
- sq. feet
|
- baths - beds |
show details | |

|
#15
S Brearly St Apt 2
Madison, WI 53703
|
- sq. feet
|
- baths - beds |
show details | |

|
#16
Okeeffe Ave, Apt 107
Sun Prairie, WI 53590
|
- sq. feet
|
- baths - beds |
show details | |

|
#17
S Hamilton St
Madison, WI 53703
|
- sq. feet
|
- baths - beds |
show details | |

|
#18
Lien Rd Apt 203
Madison, WI 53704
|
- sq. feet
|
- baths - beds |
show details | |

|
#19
Luann Ln Apt 302
Madison, WI 53713
|
- sq. feet
|
- baths - beds |
show details | |

|
#20
Magnolia Ln Apt C
Madison, WI 53713
|
- sq. feet
|
- baths - beds |
show details |
| Photo | Address | Area | Beds / Baths | Price | Details |
|---|---|---|---|---|---|

|
#21
Watts Rd, Apt 314
Madison, WI 53719
|
- sq. feet
|
- baths - beds |
show details | |

|
#22
Delaware Dr Apt 4
Sun Prairie, WI 53590
|
- sq. feet
|
- baths - beds |
show details | |

|
#23
Plaza Dr Apt 101
Madison, WI 53719
|
- sq. feet
|
- baths - beds |
show details | |

|
#24
Phillips Rd
Poynette, WI 53955
|
- sq. feet
|
- baths - beds |
show details | |

|
#25
Woodview Ct Apt 2
Madison, WI 53713
|
- sq. feet
|
- baths - beds |
show details | |

|
#26
S Park St Apt 604
Madison, WI 53715
|
- sq. feet
|
- baths - beds |
show details | |

|
#27
W Main St Apt 113
Madison, WI 53703
|
- sq. feet
|
- baths - beds |
show details | |

|
#28
N Burberry Dr Apt 1117
Madison, WI 53719
|
- sq. feet
|
- baths - beds |
show details | |

|
#29
Braxton Pl Apt A312
Madison, WI 53715
|
- sq. feet
|
- baths - beds |
show details | |

|
#30
Talc Trl
Madison, WI 53719
|
- sq. feet
|
- baths - beds |
show details |
| Photo | Address | Area | Beds / Baths | Price | Details |
|---|---|---|---|---|---|

|
#31
W Gilman St Apt 601
Madison, WI 53703
|
- sq. feet
|
- baths - beds |
show details | |

|
#32
Spring St, Unit 6203
Sun Prairie, WI 53590
|
- sq. feet
|
- baths - beds |
show details | |

|
#33
S High Point Rd # 322
Madison, WI 53719
|
- sq. feet
|
- baths - beds |
show details | |

|
#34
Silent Wind Rd
Verona, WI 53593
|
- sq. feet
|
- baths - beds |
show details | |

|
#35
Ludden Dr Apt 3
Cross Plains, WI 53528
|
- sq. feet
|
- baths - beds |
show details | |

|
#36
Pike Dr Apt 4
Madison, WI 53713
|
- sq. feet
|
- baths - beds |
show details | |

|
#37
Goucher Ln
Madison, WI 53716
|
- sq. feet
|
- baths - beds |
show details | |

|
#38
American Pkwy, Apt 413
Madison, WI 53718
|
- sq. feet
|
- baths - beds |
show details | |

|
#39
Emma Ct
Madison, WI 53716
|
- sq. feet
|
- baths - beds |
show details | |

|
#40
Providence St
Sun Prairie, WI 53590
|
- sq. feet
|
- baths - beds |
show details |
| Photo | Address | Area | Beds / Baths | Price | Details |
|---|---|---|---|---|---|

|
#41
Onsgard Rd Apt 4
Madison, WI 53704
|
- sq. feet
|
- baths - beds |
show details | |

|
#42
Crescent Rd # 7
Madison, WI 53711
|
- sq. feet
|
- baths - beds |
show details | |

|
#43
Columbus Ln Apt 106
Madison, WI 53704
|
- sq. feet
|
- baths - beds |
show details | |

|
#44
Fordem Ave Apt 109
Madison, WI 53704
|
- sq. feet
|
- baths - beds |
show details | |

|
#45
Prospect Cmns Apt 209
Sun Prairie, WI 53590
|
- sq. feet
|
- baths - beds |
show details | |

|
#46
Junction Rd Apt 29
Madison, WI 53717
|
- sq. feet
|
- baths - beds |
show details | |

|
#47
Milwaukee St, Apt 513
Madison, WI 53718
|
- sq. feet
|
- baths - beds |
show details | |

|
#48
E Dayton St
Madison, WI 53703
|
- sq. feet
|
- baths - beds |
show details | |

|
#49
Blue Aster Blvd
Sun Prairie, WI 53590
|
- sq. feet
|
- baths - beds |
show details | |

|
Check over 1 million property listings on Foreclosure.com!
|
browse all offers | |||


- 1,05193.8%White alone
- 312.8%Hispanic
- 242.1%Two or more races
- 30.3%Black alone
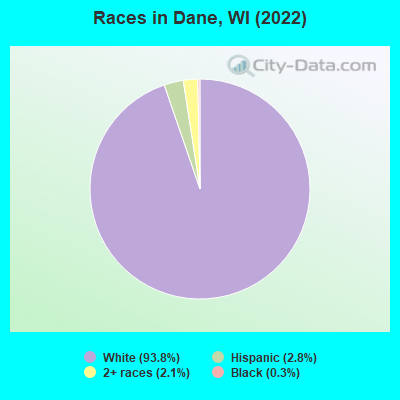
Races in Dane detailed stats: ancestries, foreign born residents, place of birth
According to our research of Wisconsin and other state lists, there were 2 registered sex offenders living in Dane, Wisconsin as of June 08, 2024.
The ratio of all residents to sex offenders in Dane is 536 to 1.
The ratio of registered sex offenders to all residents in this city is lower than the state average.
 Recent articles from our blog. Our writers, many of them Ph.D. graduates or candidates, create easy-to-read articles on a wide variety of topics.


Latest news from Dane, WI collected exclusively by city-data.com from local newspapers, TV, and radio stations
Ancestries: German (52.3%), American (11.4%), Norwegian (6.0%), Irish (4.2%), English (3.8%), Italian (3.3%).
Current Local Time: CST time zone
Incorporated in 1899
Elevation: 1070 feet
Land area: 1.13 square miles.
Population density: 957 people per square mile (low).
7 residents are foreign born
| This village: | 0.6% |
| Wisconsin: | 5.0% |
Median real estate property taxes paid for housing units with mortgages in 2022: $5,120 (1.5%)
Median real estate property taxes paid for housing units with no mortgage in 2022: $5,936 (1.6%)
Nearest city with pop. 50,000+: Madison, WI  (13.3 miles , pop. 208,054).
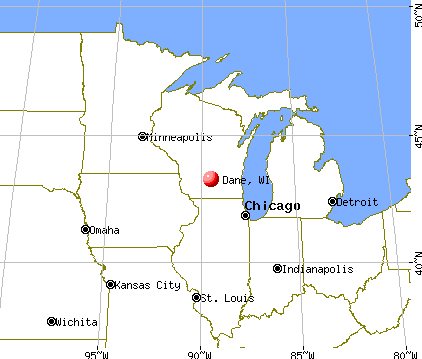
Nearest city with pop. 1,000,000+: Chicago, IL (134.6 miles , pop. 2,896,016).
Nearest cities:
), ), ), Latitude: 43.25 N, Longitude: 89.50 W
Area code commonly used in this area: 608

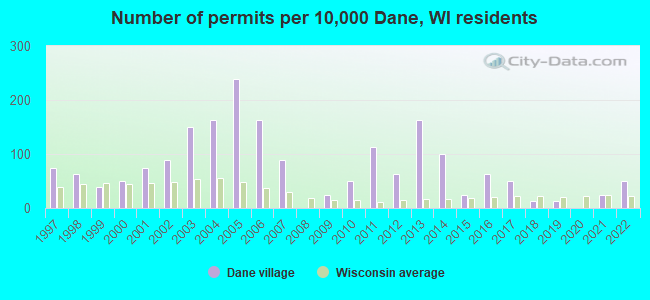
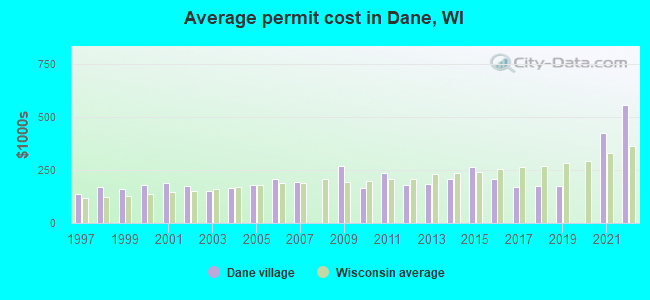
Single-family new house construction building permits:
- 2022: 4 buildings, average cost: $557,300
- 2021: 2 buildings, average cost: $423,000
- 2019: 1 building, cost: $175,000
- 2018: 1 building, cost: $175,000
- 2017: 4 buildings, average cost: $170,000
- 2016: 5 buildings, average cost: $207,800
- 2015: 2 buildings, average cost: $262,000
- 2014: 8 buildings, average cost: $207,500
- 2013: 13 buildings, average cost: $182,800
- 2012: 5 buildings, average cost: $180,900
- 2011: 9 buildings, average cost: $233,900
- 2010: 4 buildings, average cost: $162,500
- 2009: 2 buildings, average cost: $270,000
- 2007: 7 buildings, average cost: $195,200
- 2006: 13 buildings, average cost: $208,600
- 2005: 19 buildings, average cost: $178,300
- 2004: 13 buildings, average cost: $165,500
- 2003: 12 buildings, average cost: $151,700
- 2002: 7 buildings, average cost: $176,100
- 2001: 6 buildings, average cost: $187,500
- 2000: 4 buildings, average cost: $179,500
- 1999: 3 buildings, average cost: $160,000
- 1998: 5 buildings, average cost: $170,000
- 1997: 6 buildings, average cost: $139,000
| Here: | 2.0% |
| Wisconsin: | 2.7% |
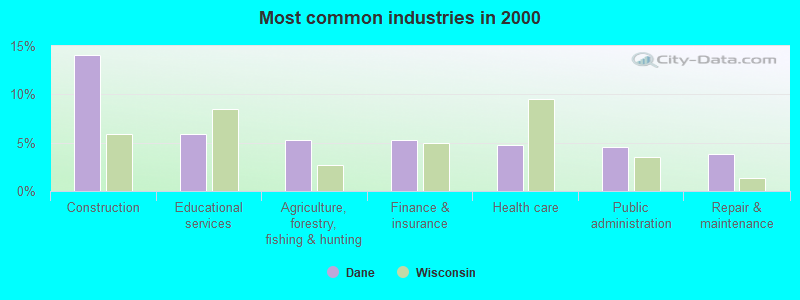
- Construction (14.1%)
- Educational services (5.9%)
- Agriculture, forestry, fishing & hunting (5.2%)
- Finance & insurance (5.2%)
- Health care (4.8%)
- Public administration (4.5%)
- Repair & maintenance (3.9%)
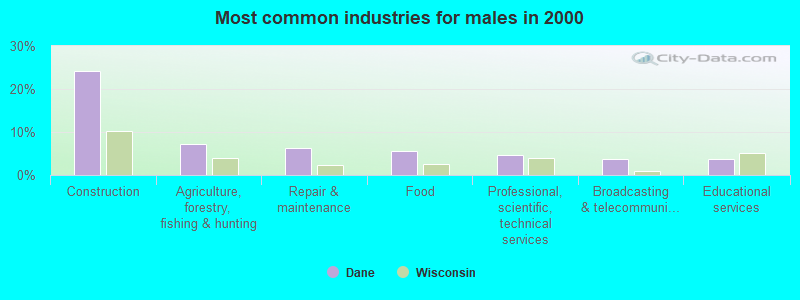
- Construction (24.2%)
- Agriculture, forestry, fishing & hunting (7.2%)
- Repair & maintenance (6.4%)
- Food (5.5%)
- Professional, scientific, technical services (4.7%)
- Broadcasting & telecommunications (3.8%)
- Educational services (3.8%)
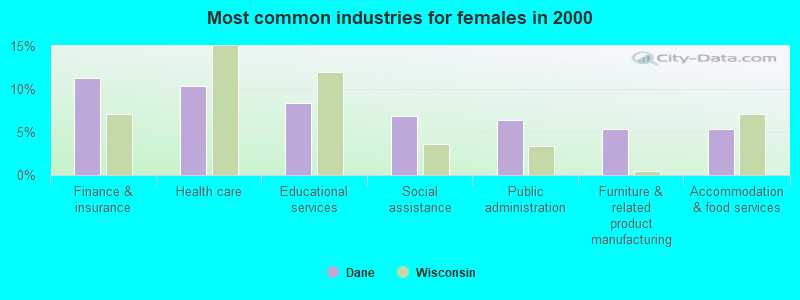
- Finance & insurance (11.3%)
- Health care (10.3%)
- Educational services (8.3%)
- Social assistance (6.9%)
- Public administration (6.4%)
- Furniture & related product manufacturing (5.4%)
- Accommodation & food services (5.4%)
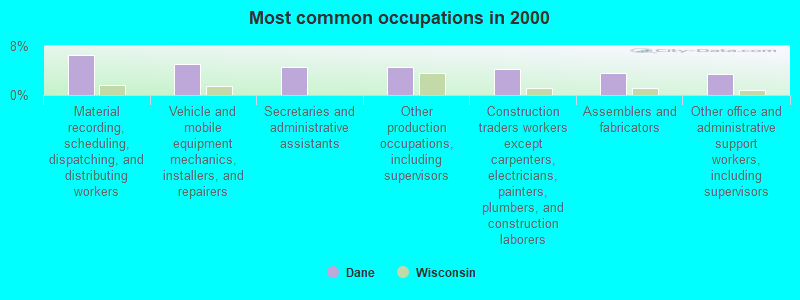
- Material recording, scheduling, dispatching, and distributing workers (6.6%)
- Vehicle and mobile equipment mechanics, installers, and repairers (5.0%)
- Secretaries and administrative assistants (4.5%)
- Other production occupations, including supervisors (4.5%)
- Construction traders workers except carpenters, electricians, painters, plumbers, and construction laborers (4.3%)
- Assemblers and fabricators (3.6%)
- Other office and administrative support workers, including supervisors (3.4%)
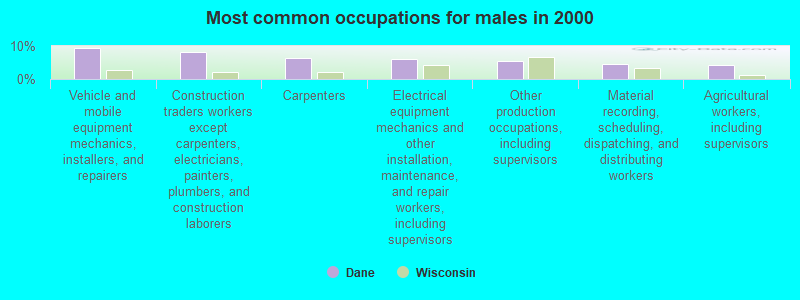
- Vehicle and mobile equipment mechanics, installers, and repairers (9.3%)
- Construction traders workers except carpenters, electricians, painters, plumbers, and construction laborers (8.1%)
- Carpenters (6.4%)
- Electrical equipment mechanics and other installation, maintenance, and repair workers, including supervisors (5.9%)
- Other production occupations, including supervisors (5.5%)
- Material recording, scheduling, dispatching, and distributing workers (4.7%)
- Agricultural workers, including supervisors (4.2%)

- Secretaries and administrative assistants (9.8%)
- Material recording, scheduling, dispatching, and distributing workers (8.8%)
- Other office and administrative support workers, including supervisors (7.4%)
- Assemblers and fabricators (5.9%)
- Customer service representatives (4.9%)
- Sales representatives, services, wholesale and manufacturing (4.4%)
- Retail sales workers, except cashiers (4.4%)
Average climate in Dane, Wisconsin
Based on data reported by over 4,000 weather stations


(lower is better)
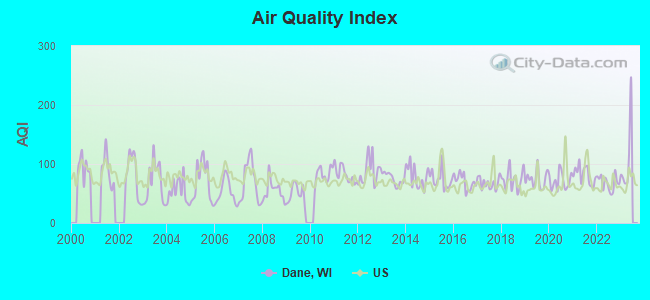
Air Quality Index (AQI) level in 2022 was 68.0. This is about average.
| City: | 68.0 |
| U.S.: | 72.6 |
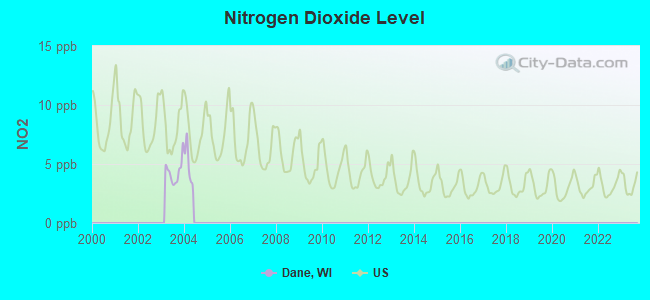
Nitrogen Dioxide (NO2) [ppb] level in 2003 was 4.36. This is about average. Closest monitor was 12.9 miles away from the city center.
| City: | 4.36 |
| U.S.: | 5.11 |
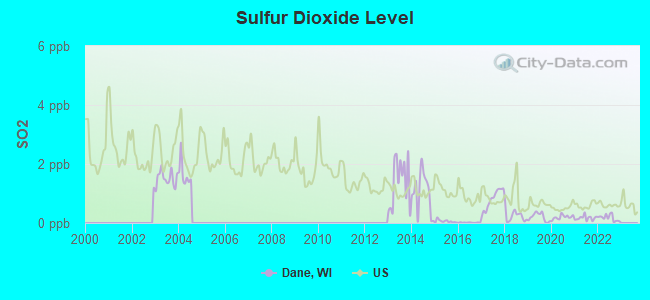
Sulfur Dioxide (SO2) [ppb] level in 2022 was 0.176. This is significantly better than average. Closest monitor was 11.4 miles away from the city center.
| City: | 0.176 |
| U.S.: | 1.515 |
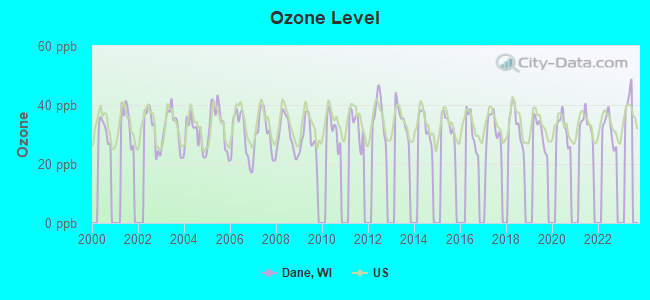
Ozone [ppb] level in 2022 was 31.8. This is about average. Closest monitor was 10.5 miles away from the city center.
| City: | 31.8 |
| U.S.: | 33.3 |
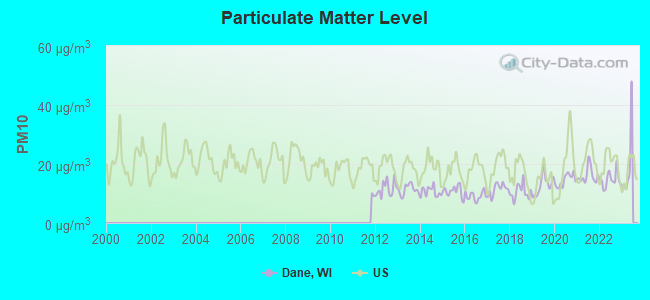
Particulate Matter (PM10) [µg/m3] level in 2022 was 14.7. This is better than average. Closest monitor was 12.7 miles away from the city center.
| City: | 14.7 |
| U.S.: | 19.2 |
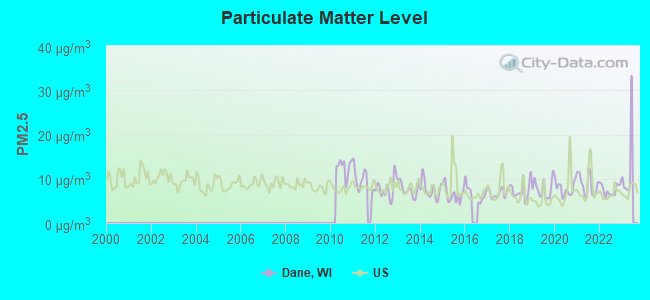
Particulate Matter (PM2.5) [µg/m3] level in 2022 was 7.52. This is about average. Closest monitor was 12.6 miles away from the city center.
| City: | 7.52 |
| U.S.: | 8.11 |
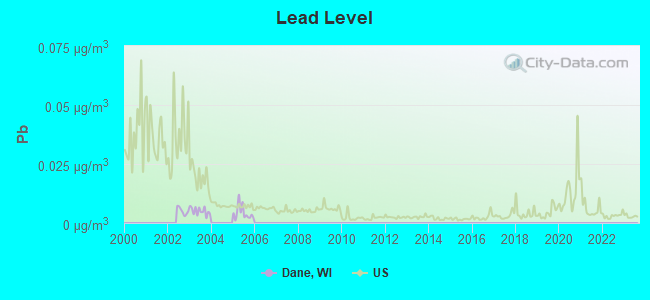
Lead (Pb) [µg/m3] level in 2005 was 0.00428. This is significantly better than average. Closest monitor was 10.5 miles away from the city center.
| City: | 0.00428 |
| U.S.: | 0.00931 |
Tornado activity:
Dane-area historical tornado activity is above Wisconsin state average. It is 74% greater than the overall U.S. average.
On 6/7/1984, a category F5 (max. wind speeds 261-318 mph) tornado 2.3 miles away from the Dane village center killed 9 people and injured 200 people and caused between $50,000 and $500,000 in damages.
On 9/26/1951, a category F4 (max. wind speeds 207-260 mph) tornado 19.7 miles away from the village center killed one person and injured 9 people and caused between $50,000 and $500,000 in damages.
Earthquake activity:
Dane-area historical earthquake activity is significantly above Wisconsin state average. It is 34% greater than the overall U.S. average.On 4/18/2008 at 09:36:59, a magnitude 5.4 (5.1 MB, 4.8 MS, 5.4 MW, 5.2 MW, Class: Moderate, Intensity: VI - VII) earthquake occurred 342.5 miles away from Dane center
On 6/28/2004 at 06:10:52, a magnitude 4.2 (4.2 MW, Depth: 6.2 mi, Class: Light, Intensity: IV - V) earthquake occurred 127.6 miles away from the city center
On 6/10/1987 at 23:48:54, a magnitude 5.1 (4.9 MB, 4.4 MS, 4.6 MS, 5.1 LG) earthquake occurred 317.7 miles away from the city center
On 4/18/2008 at 09:36:59, a magnitude 5.2 (5.2 MW, Depth: 8.9 mi) earthquake occurred 342.5 miles away from Dane center
On 2/10/2010 at 09:59:35, a magnitude 3.8 (3.8 MW, Depth: 6.2 mi, Class: Light, Intensity: II - III) earthquake occurred 102.3 miles away from the city center
On 5/2/2015 at 16:23:07, a magnitude 4.2 (4.2 MW, Depth: 2.8 mi) earthquake occurred 218.4 miles away from the city center
Magnitude types: regional Lg-wave magnitude (LG), body-wave magnitude (MB), surface-wave magnitude (MS), moment magnitude (MW)
Natural disasters:
The number of natural disasters in Dane County (18) is near the US average (15).Major Disasters (Presidential) Declared: 13
Emergencies Declared: 4
Causes of natural disasters: Storms: 12, Floods: 9, Tornadoes: 8, Winds: 2, Winter Storms: 2, Drought: 1, Hurricane: 1, Landslide: 1, Snow: 1, Snowstorm: 1, Other: 1 (Note: some incidents may be assigned to more than one category).

Hospitals and medical centers near Dane:
- WAUNAKEE MNR HLTH CARE CTR (Nursing Home, about 5 miles away; WAUNAKEE, WI)
- GOOD SAMARITAN SOCIETY-LODI (Nursing Home, about 6 miles away; LODI, WI)
- CENTRAL WI CTR FDD (Hospital, about 10 miles away; MADISON, WI)
- MENDOTA MENTAL HLTH INSTITUTE (Hospital, about 10 miles away; MADISON, WI)
- UNIV HSPTL HHA (Home Health Center, about 11 miles away; MIDDLETON, WI)
- KINDRED NURSING AND REHAB-MIDDLETON VILLAGE (Nursing Home, about 12 miles away; MIDDLETON, WI)
- MAPLEWOOD OF SAUK PRAIRIE (Nursing Home, about 12 miles away; SAUK CITY, WI)
Airports located in Dane:
- Dane Airport (WI65) (Runways: 1)
- Eberle Ranch Airport (5WN2) (Runways: 1)
Colleges/universities with over 2000 students nearest to Dane:
- Madison Area Technical College (about 13 miles; Madison, WI; Full-time enrollment: 9,603)
- Herzing University-Madison (about 13 miles; Madison, WI; FT enrollment: 3,160)
- University of Wisconsin-Madison (about 14 miles; Madison, WI; FT enrollment: 34,621)
- University of Wisconsin Colleges (about 14 miles; Madison, WI; FT enrollment: 10,019)
- Edgewood College (about 14 miles; Madison, WI; FT enrollment: 2,455)
- University of Wisconsin-Whitewater (about 48 miles; Whitewater, WI; FT enrollment: 11,124)
- University of Wisconsin-Platteville (about 62 miles; Platteville, WI; FT enrollment: 7,679)
Points of interest:
Notable location: Dane Volunteer Fire Department (A). Display/hide its location on the map
Tourist attraction: Village Clerk (Recreation Areas; 102 West Main Street).
Birthplace of: Alexander Legge - Manufacturing businesspeople.
Drinking water stations with addresses in Dane and their reported violations in the past:
DANE WATERWORKS (Population served: 1,005, Groundwater):Past monitoring violations:
- Follow-up Or Routine LCR Tap M/R - In JAN-01-2008, Contaminant: Lead and Copper Rule. Follow-up actions: St Violation/Reminder Notice (FEB-04-2009), St Public Notif requested (FEB-04-2009), St Compliance achieved (FEB-25-2009), St Public Notif received (MAR-17-2009)
- 12 regular monitoring violations
Drinking water stations with addresses in Dane that have no violations reported:
- SPRINGFIELD CORNER INN (Population served: 75, Primary Water Source Type: Groundwater)
- WHIPPOORWILL TAVERN (Population served: 58, Primary Water Source Type: Groundwater)
| This village: | 2.7 people |
| Wisconsin: | 2.4 people |
| This village: | 73.3% |
| Whole state: | 64.4% |
| This village: | 10.2% |
| Whole state: | 7.3% |
Likely homosexual households (counted as self-reported same-sex unmarried-partner households)
- Lesbian couples: 0.6% of all households
- Gay men: 0.3% of all households
For population 15 years and over in Dane:
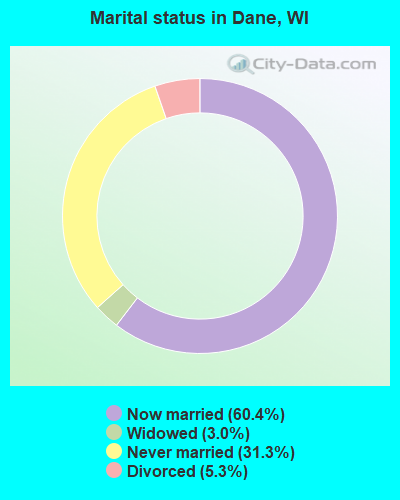
- Never married: 31.3%
- Now married: 60.4%
- Separated: 0.0%
- Widowed: 3.0%
- Divorced: 5.3%
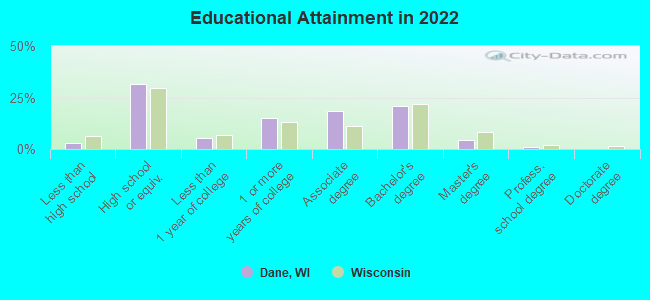
For population 25 years and over in Dane:
- High school or higher: 96.9%
- Bachelor's degree or higher: 25.7%
- Graduate or professional degree: 5.5%
- Unemployed: 4.8%
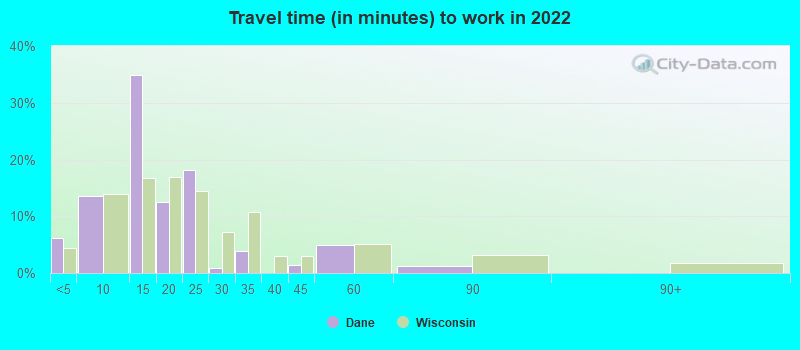
- Mean travel time to work (commute): 18.3 minutes
| Here: | 7.7 |
| Wisconsin average: | 10.4 |
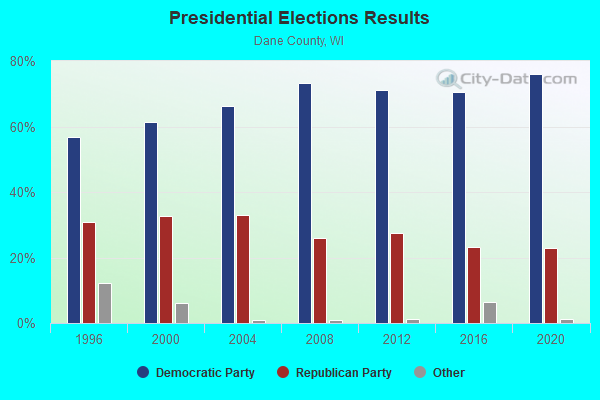
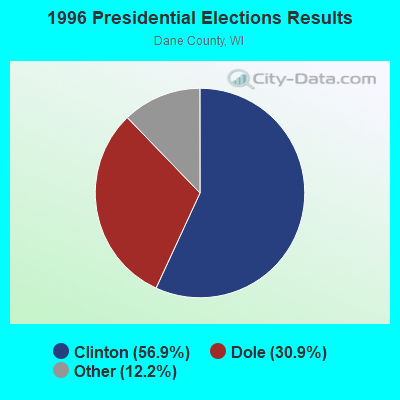
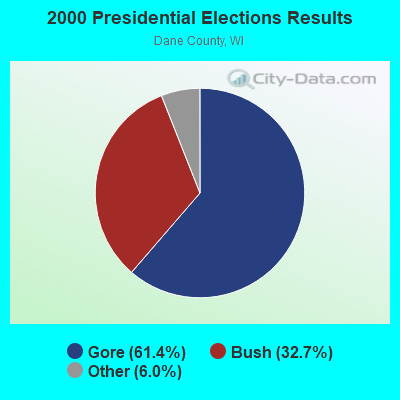


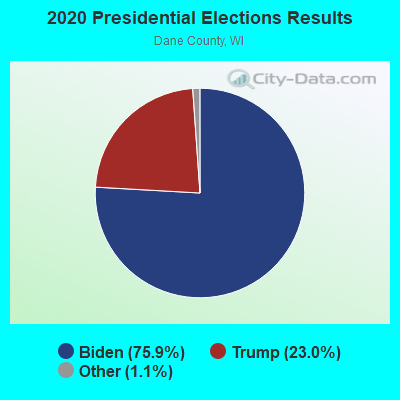
Graphs represent county-level data. Detailed 2008 Election Results
Religion statistics for Dane, WI (based on Dane County data)
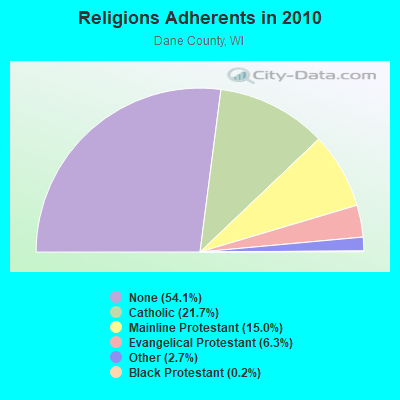
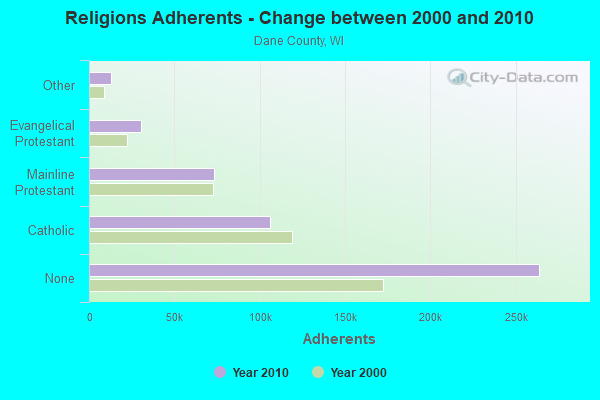
| Religion | Adherents | Congregations |
|---|---|---|
| Catholic | 106,036 | 34 |
| Mainline Protestant | 73,128 | 113 |
| Evangelical Protestant | 30,727 | 146 |
| Other | 12,968 | 49 |
| Black Protestant | 779 | 5 |
| Orthodox | 445 | 4 |
| None | 263,990 | - |
Food Environment Statistics:
| This county: | 1.53 / 10,000 pop. |
| State: | 1.86 / 10,000 pop. |
| Dane County: | 0.04 / 10,000 pop. |
| Wisconsin: | 0.11 / 10,000 pop. |
| This county: | 0.11 / 10,000 pop. |
| Wisconsin: | 0.38 / 10,000 pop. |
| This county: | 3.24 / 10,000 pop. |
| State: | 4.12 / 10,000 pop. |
| Dane County: | 8.03 / 10,000 pop. |
| State: | 8.64 / 10,000 pop. |
| Dane County: | 6.0% |
| Wisconsin: | 7.6% |
| This county: | 23.9% |
| State: | 27.5% |
| Here: | 11.1% |
| Wisconsin: | 13.0% |
Health and Nutrition:
| Dane: | 48.8% |
| Wisconsin: | 49.5% |
| Dane: | 45.8% |
| Wisconsin: | 46.6% |
| Dane: | 29.1 |
| Wisconsin: | 28.7 |
| Here: | 22.8% |
| State: | 21.4% |
| Dane: | 12.5% |
| Wisconsin: | 10.2% |
| This city: | 6.7 |
| State: | 6.8 |
| This city: | 34.4% |
| State: | 34.0% |
| Dane: | 57.0% |
| Wisconsin: | 56.3% |
| Here: | 79.4% |
| Wisconsin: | 78.5% |
More about Health and Nutrition of Dane, WI Residents
| Local government employment and payroll (March 2022) | |||||
| Function | Full-time employees | Monthly full-time payroll | Average yearly full-time wage | Part-time employees | Monthly part-time payroll |
|---|---|---|---|---|---|
| Financial Administration | 1 | $5,210 | $62,520 | 1 | $910 |
| Streets and Highways | 1 | $6,140 | $73,680 | 0 | $0 |
| Sewerage | 1 | $2,046 | $24,552 | 0 | $0 |
| Water Supply | 1 | $2,046 | $24,552 | 0 | $0 |
| Totals for Government | 4 | $15,442 | $46,326 | 1 | $910 |
Dane government finances - Expenditure in 2017 (per resident):
- Construction - General Public Buildings: $54,000 ($49.82)
Parks and Recreation: $10,000 ($9.23)
- Current Operations - Water Utilities: $210,000 ($193.73)
Sewerage: $174,000 ($160.52)
Regular Highways: $170,000 ($156.83)
Central Staff Services: $98,000 ($90.41)
Police Protection: $64,000 ($59.04)
Solid Waste Management: $52,000 ($47.97)
Local Fire Protection: $39,000 ($35.98)
Health - Other: $39,000 ($35.98)
Parks and Recreation: $37,000 ($34.13)
General - Other: $14,000 ($12.92)
Financial Administration: $12,000 ($11.07)
Judicial and Legal Services: $10,000 ($9.23)
Protective Inspection and Regulation - Other: $8,000 ($7.38)
Natural Resources - Other: $4,000 ($3.69)
- General - Interest on Debt: $72,000 ($66.42)
Dane government finances - Revenue in 2017 (per resident):
- Charges - Sewerage: $212,000 ($195.57)
Parks and Recreation: $6,000 ($5.54)
Other: $2,000 ($1.85)
- Miscellaneous - General Revenue - Other: $28,000 ($25.83)
Rents: $18,000 ($16.61)
Special Assessments: $1,000 ($0.92)
Fines and Forfeits: $1,000 ($0.92)
Donations From Private Sources: $1,000 ($0.92)
Interest Earnings: $0 ($0.00)
- Revenue - Water Utilities: $246,000 ($226.94)
- State Intergovernmental - General Local Government Support: $60,000 ($55.35)
Highways: $59,000 ($54.43)
Education: $22,000 ($20.30)
Other: $6,000 ($5.54)
- Tax - Property: $603,000 ($556.27)
Other License: $58,000 ($53.51)
Occupation and Business License - Other: $10,000 ($9.23)
Dane government finances - Debt in 2017 (per resident):
- Long Term Debt - Beginning Outstanding - Unspecified Public Purpose: $3,103,000 ($2862.55)
Outstanding Unspecified Public Purpose: $2,742,000 ($2529.52)
Retired Unspecified Public Purpose: $360,000 ($332.10)
5.62% of this county's 2021 resident taxpayers lived in other counties in 2020 ($67,560 average adjusted gross income)
| Here: | 5.62% |
| Wisconsin average: | 6.07% |
0.01% of residents moved from foreign countries ($96 average AGI)
Dane County: 0.01% Wisconsin average: 0.00%
Top counties from which taxpayers relocated into this county between 2020 and 2021:
| from Milwaukee County, WI | |
| from Cook County, IL | |
| from Rock County, WI |
6.55% of this county's 2020 resident taxpayers moved to other counties in 2021 ($75,791 average adjusted gross income)
| Here: | 6.55% |
| Wisconsin average: | 6.10% |
0.01% of residents moved to foreign countries ($41 average AGI)
Dane County: 0.01% Wisconsin average: 0.00%
Top counties to which taxpayers relocated from this county between 2020 and 2021:
| to Rock County, WI | |
| to Columbia County, WI | |
| to Milwaukee County, WI |
Strongest AM radio stations in Dane:
- WLMV (1480 AM; 10 kW; MADISON, WI; Owner: MID-WEST MANAGEMENT, INC.)
- WTSO (1070 AM; 10 kW; MADISON, WI; Owner: CAPSTAR TX LIMITED PARTNERSHIP)
- WTDY (1670 AM; 10 kW; MADISON, WI; Owner: MID-WEST MANAGEMENT, INC.)
- WHA (970 AM; 5 kW; MADISON, WI; Owner: BOARD REGENTS OF UNIV OF WI SYSTEM)
- WNWC (1190 AM; daytime; 5 kW; SUN PRAIRIE, WI; Owner: NORTHWESTERN COLLEGE)
- WIBA (1310 AM; 5 kW; MADISON, WI; Owner: CAPSTAR TX LIMITED PARTNERSHIP)
- WTMJ (620 AM; 50 kW; MILWAUKEE, WI; Owner: JOURNAL BROADCAST CORPORATION)
- WTUX (1550 AM; daytime; 5 kW; MADISON, WI)
- WHFA (1240 AM; 1 kW; POYNETTE, WI; Owner: STARBOARD BROADCASTING, INC.)
- WISN (1130 AM; 50 kW; MILWAUKEE, WI; Owner: CAPSTAR TX LIMITED PARTNERSHIP)
- WNAM (1280 AM; 50 kW; NEENAH-MENASHA, WI; Owner: CUMULUS LICENSING CORP.)
- WSPT (1010 AM; 50 kW; STEVENS POINT, WI)
- WSCR (670 AM; 50 kW; CHICAGO, IL; Owner: INFINITY BROADCASTING OPERATIONS, INC.)
Strongest FM radio stations in Dane:
- WCJZ (96.3 FM; SAUK CITY, WI; Owner: CAPSTAR TX LIMITED PARTNERSHIP)
- WERN (88.7 FM; MADISON, WI; Owner: STATE OF WISCONSIN - EDUCATIONAL COMMUNICATIONS BOARD)
- WOLX-FM (94.9 FM; BARABOO, WI; Owner: ENTERCOM MADISON LICENSE, LLC.)
- WIBA-FM (101.5 FM; MADISON, WI; Owner: CAPSTAR TX LIMITED PARTNERSHIP)
- WZEE (104.1 FM; MADISON, WI; Owner: CAPSTAR TX LIMITED PARTNERSHIP)
- WORT (89.9 FM; MADISON, WI; Owner: BACK PORCH RADIO BROADCASTING, INC.)
- W215AQ (90.9 FM; MADISON, WI; Owner: STATE OF WISCONSIN - EDUCATIONAL COMMUNICATIONS BOARD)
- WBZU (105.1 FM; WAUNAKEE, WI; Owner: ENTERCOM MADISON LICENSE, LLC.)
- WMAD-FM (92.1 FM; SUN PRAIRIE, WI; Owner: CAPSTAR TX LIMITED PARTNERSHIP)
- WNWC-FM (102.5 FM; MADISON, WI; Owner: NORTHWESTERN COLLEGE)
- WWQM-FM (106.3 FM; MIDDLETON, WI; Owner: MID-WEST MANAGEMENT INC.)
- WMMM-FM (105.5 FM; VERONA, WI; Owner: ENTERCOM MADISON LICENSE, LLC.)
- WMGN (98.1 FM; MADISON, WI; Owner: MID-WEST MANAGEMENT, INC.)
- WHIT-FM (93.1 FM; DE FOREST, WI; Owner: MID-WEST MANAGEMENT, INC.)
- WDDC (100.1 FM; PORTAGE, WI; Owner: ZOE COMMUNICATIONS, INC.)
- WJJO (94.1 FM; WATERTOWN, WI; Owner: MID-WEST MANAGMENT, INC.)
- WJWD (90.3 FM; MARSHALL, WI; Owner: CSN INTERNATIONAL)
- WTLX (100.5 FM; COLUMBUS, WI; Owner: GOOD KARMA BROADCASTING, L.L.C.)
- W277AE (103.3 FM; MADISON, WI; Owner: FAITH ACADEMY DBA WFEN)
- WSUM (91.7 FM; MADISON, WI; Owner: BD. OF REGENTS OF UNIVERSITY OF WISCONSIN SYSTEM)
TV broadcast stations around Dane:
- WISC-TV (Channel 3; MADISON, WI; Owner: TELEVISION WISCONSIN, INC.)
- WMSN-TV (Channel 47; MADISON, WI; Owner: WMSN LICENSEE, LLC)
- WKOW-TV (Channel 27; MADISON, WI; Owner: WKOW TELEVISION, INC.)
- W58CO (Channel 58; SAULT STE. MARIE, MI; Owner: MS COMMUNICATIONS, LLC)
- WHA-TV (Channel 21; MADISON, WI; Owner: BOARD OF REGENTS OF THE UNIV. OF WISCONSIN SYSTEM)
- WMTV (Channel 15; MADISON, WI; Owner: GRAY MIDAMERICA TV LICENSEE CORP.)
- W23BW (Channel 23; MADISON, WI; Owner: THREE ANGELS BROADCASTING NETWORK)
- W38CT (Channel 38; MADISON, WI; Owner: TRINITY BROADCASTING NETWORK)
- W08CK (Channel 8; MADISON-MIDDLETON, WI; Owner: HEALTHY'S, INC.)
Dane fatal accident list:
Jun 16, 2004 04:30 PM, Sr-113, Lat: 43.250240, Lon: -89.488453, Vehicles: 2, Persons: 2, Fatalities: 1
Jun 29, 2002 01:56 AM, Stevenson Rd, Vehicles: 1, Persons: 1, Fatalities: 1, Drunk persons involved: 1
Jan 5, 1980 05:56 PM, Vehicles: 1, Persons: 1, Fatalities: 1, Drunk persons involved: 1
Sep 12, 1976 11:17 PM, Vehicles: 1, Persons: 2, Fatalities: 2, Drunk persons involved: 1
Sep 12, 1975 11:17 PM, Vehicles: 1, Persons: 2, Fatalities: 2, Drunk persons involved: 1
- National Bridge Inventory (NBI) Statistics
- 1Number of bridges
- 3ft / 0.9mTotal length
- 5,300Total average daily traffic
- 7,080Total future (year 2040) average daily traffic
FCC Registered Antenna Towers:
5- Albert Roffe, 6524 Simpson Rd (Lat: 43.213194 Lon: -89.601806), Type: 76.2, Overall height: 76.2 m, Registrant: Operations, Pwachholz@airadigm.Com, , Apple-ton, Phone: (920) 707-7091
- Michelle Esposito, 6543 Simpson Rd (Lat: 43.211639 Lon: -89.601417), Type: 77.7, Overall height: 74.6 m, Registrant: Sprint Spectrum L.P., Michelle.E.Esposito@sprint.Com, , Rosem-ont, Phone: (847) 318-3421
- Surya Charles, 6543 Simpson Rd (Lat: 43.211639 Lon: -89.601417), Type: 77.7, Overall height: 74.6 m, Registrant: Sprint Spectrum L.P., Rfreg@sprint.Com, , KSOPHT0101-Z3390 Overl-and Park, Phone: (877) 265-6872
- Scott R Fansler, 6543 Simpson Rd (Lat: 43.211639 Lon: -89.601417), Type: 77.7, Overall height: 74.6 m, Registrant: Sprint Spectrum L.P., Rfreg@sprint.Com, , KSOPHT0101-Z3390 Overl-and Park, Phone: (877) 265-6872
- Cayla Gamble, 6143 Lodi-Springfield Rd (Lat: 43.192417 Lon: -89.549028), Type: 48.8, Structure height: 55025 m, Overall height: 47.2 m, Registrant: Holland & Knight LLP, Peter.Connolly@hklaw.Com, , Washi-ngton, Phone: (202) 862-5989
FCC Registered Broadcast Land Mobile Towers:
5- Lat: 43.250389 Lon: -89.498139, Call Sign: WQRX552,
Assigned Frequencies: 451.437 MHz, Grant Date: 07/24/2023, Expiration Date: 08/23/2032, Certifier: Rebecca Kemper, Registrant: Village Of Dane, 102 W Main St, Dane, WI 53901, Phone: (608) 849-5422, Fax: (608) 849-6412, Email:
- 7864 Madigan Road (Lat: 43.288139 Lon: -89.451722), Call Sign: WQVV343,
Assigned Frequencies: 468.762 MHz, Grant Date: 05/19/2015, Expiration Date: 05/19/2025, Certifier: Stan Dohm, Registrant: General Communications Inc, 2880 Commerce Park Drive, Madison, WI 53719, Phone: (608) 310-7091, Email:
- 115 Dane St (Lat: 43.251028 Lon: -89.499278), Call Sign: WRBT796,
Assigned Frequencies: 452.762 MHz, 457.762 MHz, Grant Date: 06/18/2018, Expiration Date: 06/18/2028, Certifier: Ron Wenger, Registrant: General Communications Inc, 2880 Commerce Park Drive, Madison, WI 53719, Phone: (608) 310-7091, Email:
- 6867 Lavina Road (Lat: 43.218667 Lon: -89.521778), Call Sign: WRFD778,
Assigned Frequencies: 464.037 MHz, 464.337 MHz, 469.337 MHz, Grant Date: 02/08/2020, Expiration Date: 02/08/2030, Certifier: Devin Helt, Registrant: General Communications Inc, 2880 Commerce Park Drive, Madison, WI 53719, Phone: (608) 310-7091, Email:
- 6828 Old 113 Rd (Lat: 43.229722 Lon: -89.470278), Call Sign: WRMV490,
Assigned Frequencies: 464.237 MHz, 469.237 MHz, Grant Date: 06/10/2021, Expiration Date: 06/10/2031, Certifier: Virgil Ripp, Registrant: General Communications Inc, 2880 Commerce Park Drive, Madison, WI 53719, Phone: (608) 310-7091, Email:
FCC Registered Microwave Towers:
2- 7284 Patton Rd .5 Mi N Of Cth V 4.1 Mi E Of (Lat: 43.257750 Lon: -89.417611), Structure height: 4.3 m, Overall height: 7.6 m, Call Sign: WNTY659,
Assigned Frequencies: 954.750 MHz, Grant Date: 04/19/2000, Expiration Date: 04/25/2010, Cancellation Date: 06/26/2010, Phone: (608) 252-7276
- SPRINGFIELD CR, 6482 Simpson (Lat: 43.212944 Lon: -89.598889), Type: Ltower, Structure height: 54.8 m, Overall height: 56 m, Call Sign: WRWA706,
Assigned Frequencies: 10755.0 MHz, Grant Date: 01/31/2023, Expiration Date: 01/31/2033, Certifier: Douglas Chambers, Registrant: Wilkinson Barker Knauer, LLP, 1800 M Street Nw, Suite 800n, Washington, DC 20036, Phone: (202) 383-3420, Fax: (202) 783-5851, Email:
FCC Registered Amateur Radio Licenses:
1- Call Sign: KD6HYI, Licensee ID: L00419131, Grant Date: 01/09/2002, Expiration Date: 04/07/2012, Cancellation Date: 04/04/2009, Registrant: Benjamin E Smith, 606 Shyla Way, Dane, WI 53529
FAA Registered Aircraft:
2- Aircraft: SMILTNEEK MARTIN M SONEX (Category: Land, Seats: 2, Weight: Up to 12,499 Pounds), Engine: AMA/EXPR UNKNOWN ENG (Reciprocating)
N-Number: 173CP, N173CP, N-173CP, Serial Number: 173, Year manufactured: 2003, Airworthiness Date: 12/17/2003, Certificate Issue Date: 12/23/2009
Registrant (Individual): Leroy E Brandt, 611 Snyder Dr, Dane, WI 53529 - Aircraft: BURLEIGH RON GLASTAR (Category: Land, Seats: 2, Weight: Up to 12,499 Pounds), Engine: LYCOMING 0-320 SERIES (180 HP) (Reciprocating)
N-Number: 62592, N62592, N-62592, Serial Number: 5108, Year manufactured: 1997, Airworthiness Date: 04/01/1997, Certificate Issue Date: 07/14/2020
Registrant (Individual): Nathan D Wagner, 7424 Harmony Pond Rd, Dane, WI 53529
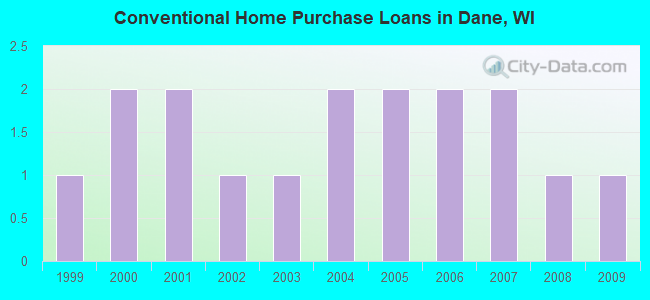
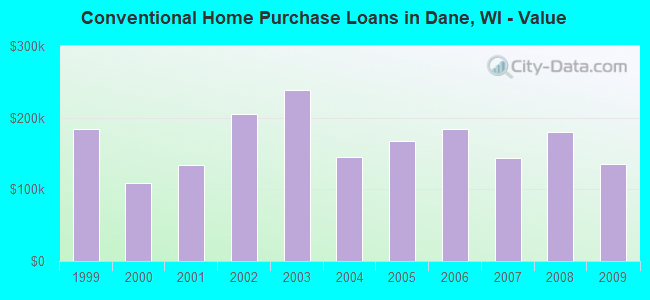
| Home Mortgage Disclosure Act Aggregated Statistics For Year 2009 (Based on 1 partial tract) | ||||
| B) Conventional Home Purchase Loans | C) Refinancings | |||
|---|---|---|---|---|
| Number | Average Value | Number | Average Value | |
| LOANS ORIGINATED | 1 | $135,840 | 7 | $175,919 |
| APPLICATIONS APPROVED, NOT ACCEPTED | 0 | $0 | 0 | $0 |
| APPLICATIONS DENIED | 0 | $0 | 1 | $215,290 |
| APPLICATIONS WITHDRAWN | 0 | $0 | 1 | $149,370 |
| FILES CLOSED FOR INCOMPLETENESS | 0 | $0 | 0 | $0 |
Detailed HMDA statistics for the following Tracts: 0132.00
2003 - 2018 National Fire Incident Reporting System (NFIRS) incidents
- Fire incident types reported to NFIRS in Dane, WI
- 6447.4%Outside Fires
- 5238.5%Structure Fires
- 1813.3%Mobile Property/Vehicle Fires
- 10.7%Other
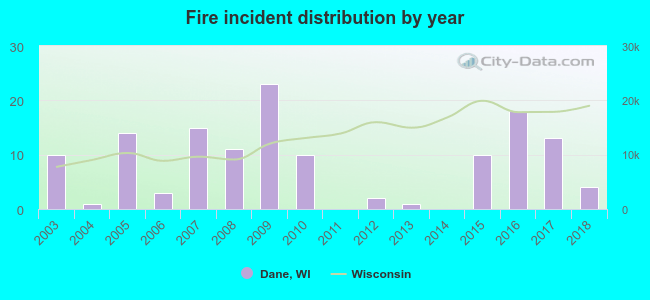 According to the data from the years 2003 - 2018 the average number of fires per year is 8. The highest number of reported fire incidents - 23 took place in 2009, and the least - 0 in 2011. The data has a dropping trend.
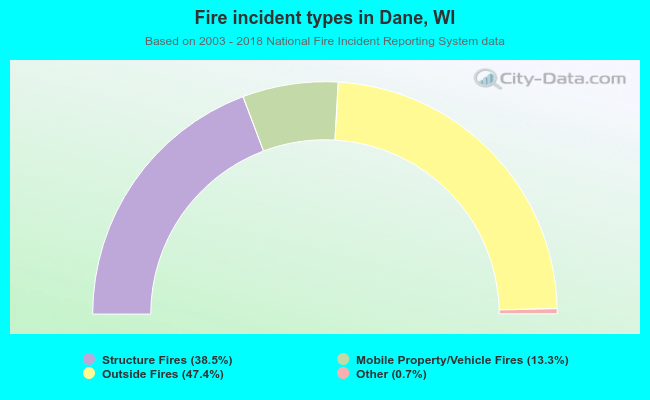 When looking into fire subcategories, the most reports belonged to: Outside Fires (47.4%), and Structure Fires (38.5%).
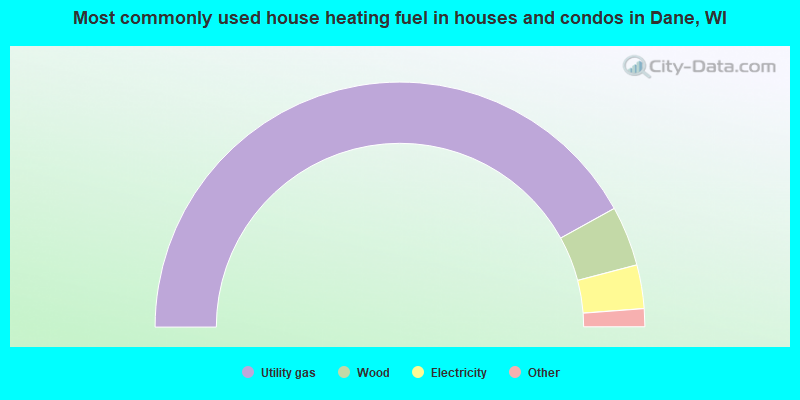
- 84.6%Utility gas
- 8.0%Wood
- 5.8%Electricity
- 1.0%Bottled, tank, or LP gas
- 0.6%Other fuel
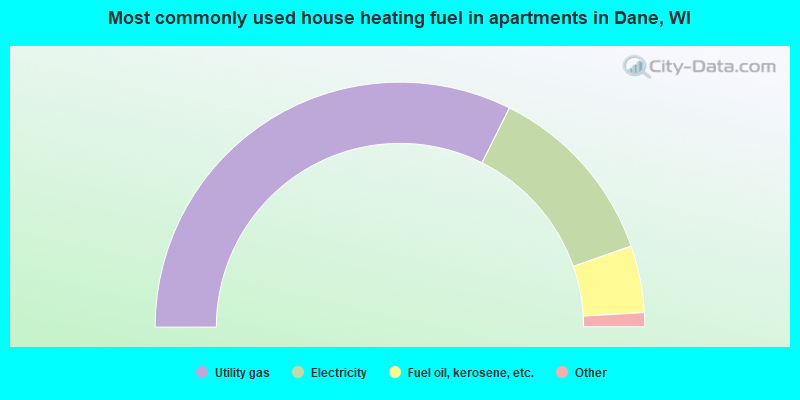
- 66.0%Utility gas
- 25.0%Electricity
- 9.0%Fuel oil, kerosene, etc.
Dane compared to Wisconsin state average:
- Unemployed percentage below state average.
- Black race population percentage significantly below state average.
- Hispanic race population percentage below state average.
- Median age significantly below state average.
- Foreign-born population percentage significantly below state average.
- Length of stay since moving in significantly above state average.
Dane on our top lists:
- #75 on the list of "Top 101 cities with the most residents born in Netherlands (population 500+)"
- #4 on the list of "Top 101 counties with the largest increase in the number of infant deaths per 1000 residents 2000-2006 to 2007-2013 (pop. 50,000+)"
- #39 on the list of "Top 101 counties with the most Mainline Protestant adherents"
- #45 on the list of "Top 101 counties with highest percentage of residents voting for Obama (Democrat) in the 2012 Presidential Election (pop. 50,000+)"
- #48 on the list of "Top 101 counties with the highest ground withdrawal of fresh water for public supply"
- #64 on the list of "Top 101 counties with the lowest percentage of residents relocating from foreign countries between 2010 and 2011"

|
|
Total of 18 patent applications in 2008-2024.