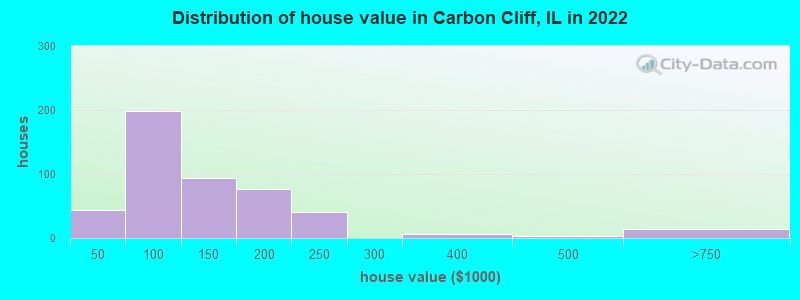
Estimated median house or condo value in 2022: $106,324 (it was $68,300 in 2000)
Carbon Cliff:
$106,324
IL:
$251,600
Mean prices in 2022:all housing units: $193,586; detached houses: $199,126; townhouses or other attached units: $224,521; in 2-unit structures: $97,393; in 3-to-4-unit structures: $299,927; in 5-or-more-unit structures: $112,284; mobile homes: $18,969
Median gross rent in 2022: $899.
March 2022 cost of living index in Carbon Cliff: 84.7 (less than average, U.S. average is 100)
Percentage of residents living in poverty in 2022: 17.9%
(17.8% for White Non-Hispanic residents, 3.0% for Black residents, 27.6% for Hispanic or Latino residents, 23.6% for two or more races residents)
Latest news from Carbon Cliff, IL collected exclusively by city-data.com from local newspapers, TV, and radio stations
Ancestries: German (31.5%), Belgian (5.4%), American (4.2%), English (4.2%), Swedish (3.6%), Irish (3.2%).
Current Local Time: CST time zone
Incorporated on 03/09/1907
Elevation: 590 feet
Land area: 2.04 square miles.
Population density: 881 people per square mile (low).
111 residents are foreign born (3.2% Latin America, 2.0% Africa).
This village:
5.6%
Illinois:
14.1%
Median real estate property taxes paid for housing units with mortgages in 2022: $1,750 (1.9%) Median real estate property taxes paid for housing units with no mortgage in 2022: $2,326 (1.6%)
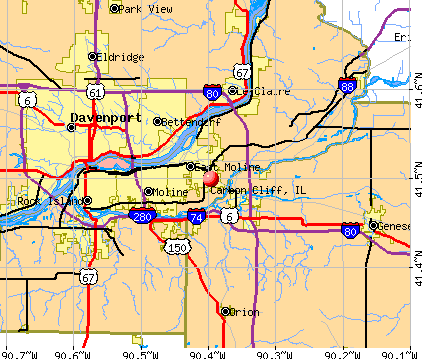
Nearest city with pop. 50,000+: Davenport, IA (10.5 miles , pop. 98,359).
Nearest city with pop. 200,000+: Madison, WI (120.4 miles , pop. 208,054).
Nearest city with pop. 1,000,000+: Chicago, IL (142.3 miles , pop. 2,896,016).
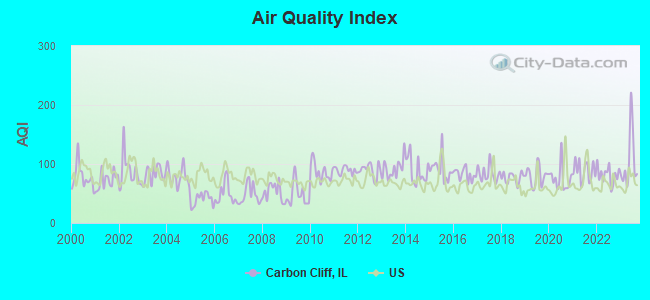
Air Quality Index (AQI) level in 2023 was 104. This is significantly worse than average.
City:
104
U.S.:
73
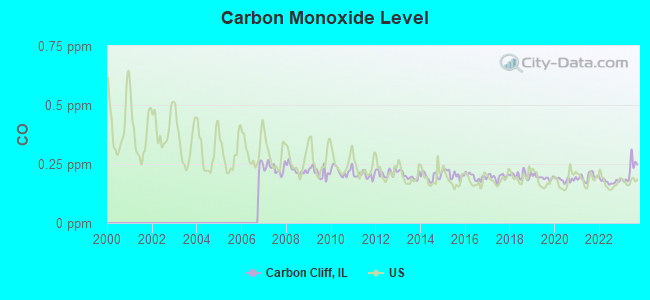
Carbon Monoxide (CO) [ppm] level in 2023 was 0.220. This is about average.Closest monitor was 6.1 miles away from the city center.
City:
0.220
U.S.:
0.251
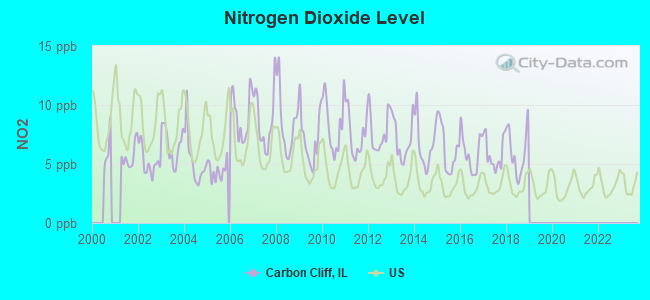
Nitrogen Dioxide (NO2) [ppb] level in 2018 was 6.00. This is about average.Closest monitor was 2.5 miles away from the city center.
City:
6.00
U.S.:
5.11
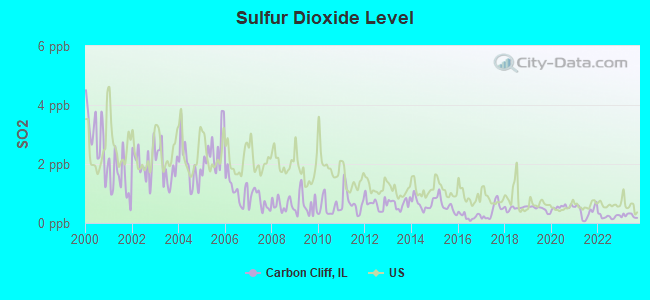
Sulfur Dioxide (SO2) [ppb] level in 2023 was 0.251. This is significantly better than average.Closest monitor was 2.5 miles away from the city center.
City:
0.251
U.S.:
1.515
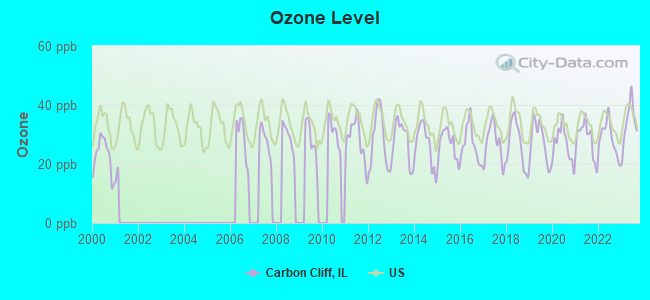
Ozone [ppb] level in 2023 was 33.9. This is about average.Closest monitor was 6.2 miles away from the city center.
City:
33.9
U.S.:
33.3
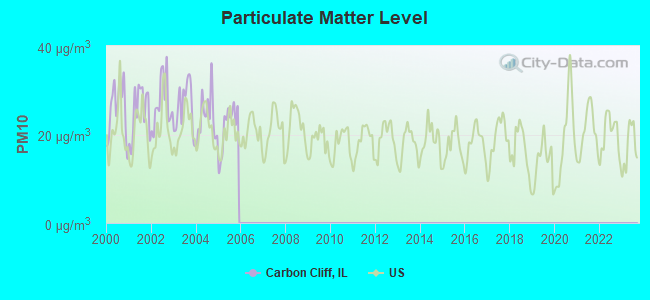
Particulate Matter (PM10) [µg/m3] level in 2005 was 21.7. This is about average.Closest monitor was 9.7 miles away from the city center.
City:
21.7
U.S.:
19.2
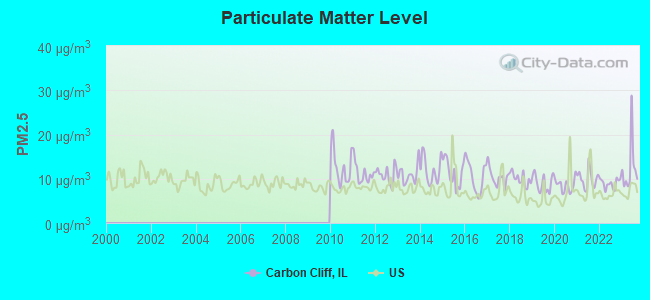
Particulate Matter (PM2.5) [µg/m3] level in 2023 was 12.4. This is significantly worse than average.Closest monitor was 6.2 miles away from the city center.
City:
12.4
U.S.:
8.1
Tornado activity:
Carbon Cliff-area historical tornado activity is near Illinois state average. It is 73% greater than the overall U.S. average.
On 3/29/1981, a category F4 (max. wind speeds 207-260 mph) tornado 26.3 miles away from the Carbon Cliff village center causedbetween $500,000 and $5,000,000 in damages.
On 4/19/1966, a category F3 (max. wind speeds 158-206 mph) tornado 5.4 miles away from the village center causedbetween $50,000 and $500,000 in damages.
Earthquake activity:
Carbon Cliff-area historical earthquake activity is significantly above Illinois state average. It is 122% greater than the overall U.S. average.
On 4/18/2008 at 09:36:59, a magnitude 5.4 (5.1 MB, 4.8 MS, 5.4 MW, 5.2 MW, Class: Moderate, Intensity: VI - VII) earthquake occurred 249.2 miles away from Carbon Cliff center On 6/10/1987 at 23:48:54, a magnitude 5.1 (4.9 MB, 4.4 MS, 4.6 MS, 5.1 LG) earthquake occurred 227.8 miles away from Carbon Cliff center On 4/18/2008 at 09:36:59, a magnitude 5.2 (5.2 MW, Depth: 8.9 mi) earthquake occurred 249.2 miles away from the city center On 6/28/2004 at 06:10:52, a magnitude 4.2 (4.2 MW, Depth: 6.2 mi, Class: Light, Intensity: IV - V) earthquake occurred 77.6 miles away from the city center On 6/18/2002 at 17:37:15, a magnitude 5.0 (4.3 MB, 4.6 MW, 5.0 LG) earthquake occurred 279.9 miles away from the city center On 4/18/2008 at 15:14:16, a magnitude 4.8 (4.5 MB, 4.8 MW, 4.6 MW) earthquake occurred 248.9 miles away from Carbon Cliff center Magnitude types: regional Lg-wave magnitude (LG), body-wave magnitude (MB), surface-wave magnitude (MS), moment magnitude (MW)
Natural disasters:
The number of natural disasters in Rock Island County (14) is near the US average (15). Major Disasters (Presidential) Declared: 11 Emergencies Declared: 1
Causes of natural disasters: Floods: 11, Storms: 9, Hurricane: 1, Snowstorm: 1, Tornado: 1, Wind: 1, Winter Storm: 1, Other: 1 (Note: some incidents may be assigned to more than one category).
Hospitals and medical centers near Carbon Cliff:
ASPEN REHAB AND HEALTH CARE (Nursing Home, about 2 miles away; SILVIS, IL)
QUAD CITIES KIDNEY CENTER SILVIS, LLC (Dialysis Facility, about 2 miles away; SILVIS, IL)
ILLINI RESTORATIVE CARE (Nursing Home, about 2 miles away; SILVIS, IL)
QUAD CITIES KIDNEY CENTER LTD (Dialysis Facility, about 3 miles away; MOLINE, IL)
EAST MOLINE CARE CTR (Nursing Home, about 3 miles away; EAST MOLINE, IL)
FOREST HILL HEALTH AND REHAB (Nursing Home, about 3 miles away; EAST MOLINE, IL)
SMITH SQUARE (Hospital, about 3 miles away; MOLINE, IL)
Amtrak stations near Carbon Cliff:
7 miles: MOLINE (QUAD CITY AIRPORT, 2200 69TH ST.) - Bus Station . Services: enclosed waiting area, public restrooms, public payphones, call for taxi service.
10 miles: DAVENPORT (BURLINGTON DEPOT, 304 WEST RIVER DR.) - Bus Station . Services: enclosed waiting area, public restrooms, public payphones, taxi stand.
Operable nuclear power plants near Carbon Cliff:
13 miles: Quad Cities 1 and 2 in Cordova, IL.
Colleges/universities with over 2000 students nearest to Carbon Cliff:
Black Hawk College (about 4 miles; Moline, IL; Full-time enrollment: 5,086)
Augustana College (about 9 miles; Rock Island, IL; FT enrollment: 2,555)
Notable locations in Carbon Cliff: Mansur Camp (A), Carbon Cliff Village Hall (B), Carbon Cliff Volunteer Fire Protection District (C). Display/hide their locations on the map
MCL, Monthly (TCR) - In OCT-2009, Contaminant: Coliform. Follow-up actions: St Public Notif requested (NOV-17-2009), St Violation/Reminder Notice (NOV-17-2009), St Public Notif received (DEC-09-2009), St Compliance achieved (MAY-01-2010)
MCL, Average - Between JUL-2007 and SEP-2007, Contaminant: Combined Radium (-226 and -228). Follow-up actions: St Formal NOV issued (DEC-14-2006), St Compliance Meeting conducted (FEB-08-2007), St Public Notif requested (OCT-18-2007), St Violation/Reminder Notice (OCT-18-2007), St Compliance achieved (OCT-22-2007), St Public Notif received (FEB-07-2008)
MCL, Average - Between APR-2007 and JUN-2007, Contaminant: Combined Radium (-226 and -228). Follow-up actions: St Formal NOV issued (DEC-14-2006), St Compliance Meeting conducted (FEB-08-2007), St Public Notif requested (JUL-19-2007), St Violation/Reminder Notice (JUL-19-2007), St Public Notif received (AUG-01-2007), St Compliance achieved (OCT-22-2007)
MCL, Average - Between JAN-2007 and MAR-2007, Contaminant: Combined Radium (-226 and -228). Follow-up actions: St Formal NOV issued (DEC-14-2006), St Compliance Meeting conducted (FEB-08-2007), St Public Notif requested (APR-24-2007), St Violation/Reminder Notice (APR-24-2007), St Public Notif received (MAY-04-2007), St Compliance achieved (OCT-22-2007)
MCL, Average - Between OCT-2006 and DEC-2006, Contaminant: Combined Radium (-226 and -228). Follow-up actions: St Public Notif requested (DEC-07-2006), St Violation/Reminder Notice (DEC-07-2006), St Formal NOV issued (DEC-14-2006), St Public Notif received (JAN-19-2007), St Compliance Meeting conducted (FEB-08-2007), St Compliance achieved (OCT-22-2007)
Past monitoring violations:
Monitoring and Reporting (DBP) - Between OCT-2009 and DEC-2009, Contaminant: Chlorine. Follow-up actions: St Public Notif requested (NOV-17-2009), St Violation/Reminder Notice (NOV-17-2009), St Compliance achieved (DEC-01-2009), St Public Notif received (MAY-24-2010)
Monitoring, Repeat Major (TCR) - In OCT-2009, Contaminant: Coliform (TCR). Follow-up actions: St Public Notif requested (NOV-17-2009), St Violation/Reminder Notice (NOV-17-2009), St Compliance achieved (MAY-01-2010), St Public Notif received (MAY-24-2010)
Monitoring and Reporting (DBP) - Between JUL-2009 and SEP-2009, Contaminant: Chlorine. Follow-up actions: St Compliance achieved (AUG-11-2009), St Public Notif requested (AUG-12-2009), St Violation/Reminder Notice (AUG-12-2009), St Public Notif received (MAY-24-2010)
Monitoring and Reporting (DBP) - Between JAN-2009 and MAR-2009, Contaminant: Chlorine. Follow-up actions: St Violation/Reminder Notice (FEB-18-2009), St Compliance achieved (FEB-20-2009)
One regular monitoring violation
EAST LAWN WATER ASSOCIATION (Population served: 160, Groundwater):
Past monitoring violations:
Lead Consumer Notice - In JAN-02-2013, Contaminant: Lead and Copper Rule. Follow-up actions: St Violation/Reminder Notice (JAN-04-2013), St Compliance achieved (JAN-14-2013)
Monitoring and Reporting (DBP) - Between JUL-2009 and SEP-2009, Contaminant: Chlorine. Follow-up actions: St Compliance achieved (AUG-11-2009), St Public Notif requested (AUG-12-2009), St Violation/Reminder Notice (AUG-12-2009), St Public Notif received (OCT-14-2009)
Monitoring and Reporting (DBP) - Between OCT-2008 and DEC-2008, Contaminant: Chlorine. Follow-up actions: St Violation/Reminder Notice (JAN-14-2009), St Compliance achieved (JAN-22-2009)
Average household size:
This village:
2.5 people
Illinois:
2.6 people
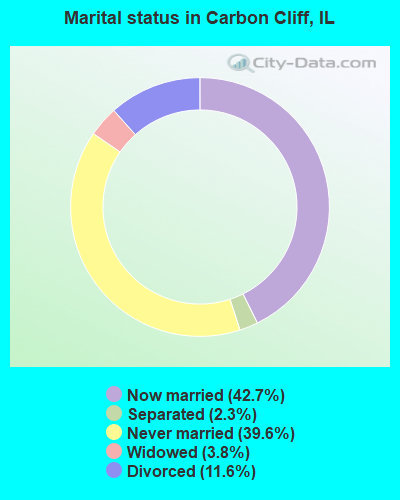
Percentage of family households:
This village:
67.1%
Whole state:
65.8%
Percentage of households with unmarried partners:
This village:
10.8%
Whole state:
6.3%
Likely homosexual households (counted as self-reported same-sex unmarried-partner households)
Lesbian couples: 0.4% of all households
Gay men: 0.2% of all households
30 people in homes or halfway houses for drug/alcohol abuse in 2000
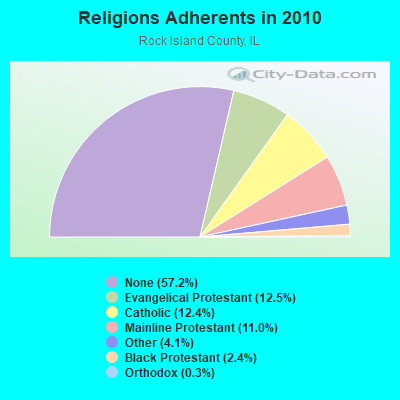
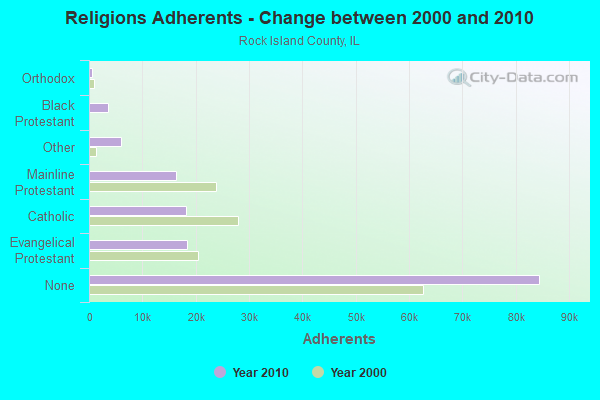
Religion statistics for Carbon Cliff, IL (based on Rock Island County data)
Religion
Adherents
Congregations
Evangelical Protestant
18,447
90
Catholic
18,258
14
Mainline Protestant
16,294
52
Other
6,037
12
Black Protestant
3,577
9
Orthodox
475
2
None
84,458
-
Source: Clifford Grammich, Kirk Hadaway, Richard Houseal, Dale E.Jones, Alexei Krindatch, Richie Stanley and Richard H.Taylor. 2012. 2010 U.S.Religion Census: Religious Congregations & Membership Study. Association of Statisticians of American Religious Bodies. Jones, Dale E., et al. 2002. Congregations and Membership in the United States 2000. Nashville, TN: Glenmary Research Center. Graphs represent county-level data
CARBON CLIFF, 344 1/2 Valley View (Lat: 41.499639 Lon: -90.394750), Type: Tank, Structure height: 34.1 m, Overall height: 36.3 m, Call Sign: WQRK614, Assigned Frequencies: 17965.0 MHz, 18015.0 MHz, 18065.0 MHz, 18115.0 MHz, Grant Date: 05/02/2023, Expiration Date: 06/05/2033, Certifier: John Monday, Registrant: At&t Services, Inc., 208 S Akard St, 20f, Dallas, TX 75202, Phone: (855) 699-7073, Email:
FCC Registered Amateur Radio Licenses:
1
Call Sign: KD9EVF, Licensee ID: L01969041, Grant Date: 10/23/2015, Expiration Date: 10/23/2025, Cancellation Date: 12/15/2018, Certifier: Bill G Hintz, Registrant: Bill G Hintz, Carbon Cliff, IL 61239
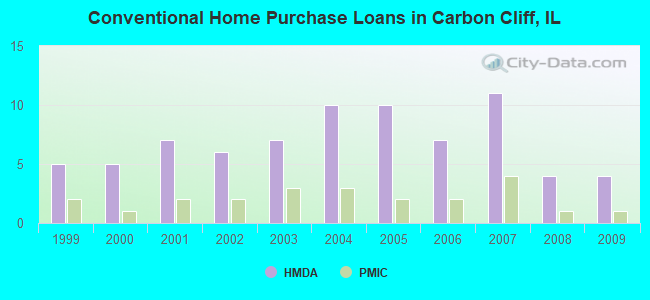
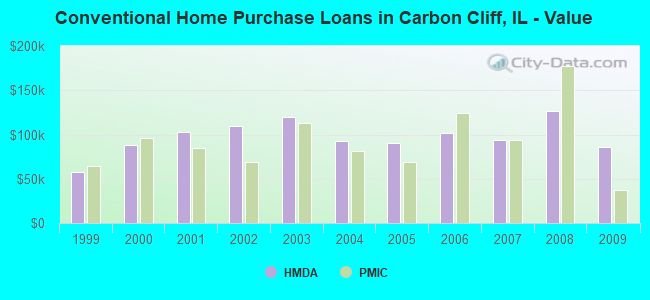
Home Mortgage Disclosure Act Aggregated Statistics For Year 2009 (Based on 1 partial tract)
A) FHA, FSA/RHS & VA Home Purchase Loans
B) Conventional Home Purchase Loans
C) Refinancings
D) Home Improvement Loans
F) Non-occupant Loans on < 5 Family Dwellings (A B C & D)
Number
Average Value
Number
Average Value
Number
Average Value
Number
Average Value
Number
Average Value
LOANS ORIGINATED
3
$76,263
4
$86,010
16
$104,188
3
$12,787
1
$110,070
APPLICATIONS APPROVED, NOT ACCEPTED
0
$0
0
$0
2
$120,180
0
$0
0
$0
APPLICATIONS DENIED
1
$99,360
1
$54,260
4
$96,898
1
$17,280
0
$0
APPLICATIONS WITHDRAWN
0
$0
0
$0
3
$125,397
1
$3,800
0
$0
FILES CLOSED FOR INCOMPLETENESS
0
$0
0
$0
1
$71,370
0
$0
0
$0
Aggregated Statistics For Year 2008 (Based on 1 partial tract)
A) FHA, FSA/RHS & VA Home Purchase Loans
B) Conventional Home Purchase Loans
C) Refinancings
D) Home Improvement Loans
F) Non-occupant Loans on < 5 Family Dwellings (A B C & D)
Number
Average Value
Number
Average Value
Number
Average Value
Number
Average Value
Number
Average Value
LOANS ORIGINATED
2
$102,815
4
$126,100
11
$92,275
3
$23,960
1
$115,080
APPLICATIONS APPROVED, NOT ACCEPTED
0
$0
0
$0
1
$149,820
0
$0
0
$0
APPLICATIONS DENIED
0
$0
1
$35,940
4
$97,805
1
$39,570
0
$0
APPLICATIONS WITHDRAWN
0
$0
0
$0
2
$125,020
0
$0
0
$0
FILES CLOSED FOR INCOMPLETENESS
0
$0
0
$0
1
$87,090
0
$0
0
$0
Aggregated Statistics For Year 2007 (Based on 1 partial tract)
A) FHA, FSA/RHS & VA Home Purchase Loans
B) Conventional Home Purchase Loans
C) Refinancings
D) Home Improvement Loans
F) Non-occupant Loans on < 5 Family Dwellings (A B C & D)
Number
Average Value
Number
Average Value
Number
Average Value
Number
Average Value
Number
Average Value
LOANS ORIGINATED
2
$69,120
11
$94,160
10
$67,461
4
$17,322
1
$68,950
APPLICATIONS APPROVED, NOT ACCEPTED
0
$0
1
$35,600
2
$115,000
0
$0
0
$0
APPLICATIONS DENIED
0
$0
1
$69,810
6
$83,865
1
$57,370
0
$0
APPLICATIONS WITHDRAWN
1
$34,910
2
$64,370
2
$97,720
0
$0
0
$0
FILES CLOSED FOR INCOMPLETENESS
0
$0
0
$0
1
$35,600
0
$0
0
$0
Aggregated Statistics For Year 2006 (Based on 1 partial tract)
A) FHA, FSA/RHS & VA Home Purchase Loans
B) Conventional Home Purchase Loans
C) Refinancings
D) Home Improvement Loans
F) Non-occupant Loans on < 5 Family Dwellings (A B C & D)
Number
Average Value
Number
Average Value
Number
Average Value
Number
Average Value
Number
Average Value
LOANS ORIGINATED
1
$61,170
7
$101,977
11
$75,891
4
$20,002
1
$68,080
APPLICATIONS APPROVED, NOT ACCEPTED
0
$0
1
$35,080
2
$62,900
0
$0
0
$0
APPLICATIONS DENIED
0
$0
1
$71,020
7
$72,674
1
$26,440
0
$0
APPLICATIONS WITHDRAWN
0
$0
0
$0
3
$77,817
0
$0
0
$0
FILES CLOSED FOR INCOMPLETENESS
0
$0
0
$0
1
$74,300
0
$0
0
$0
Aggregated Statistics For Year 2005 (Based on 1 partial tract)
A) FHA, FSA/RHS & VA Home Purchase Loans
B) Conventional Home Purchase Loans
C) Refinancings
D) Home Improvement Loans
F) Non-occupant Loans on < 5 Family Dwellings (A B C & D)
Number
Average Value
Number
Average Value
Number
Average Value
Number
Average Value
Number
Average Value
LOANS ORIGINATED
1
$92,620
10
$90,253
13
$78,717
4
$36,762
1
$93,480
APPLICATIONS APPROVED, NOT ACCEPTED
0
$0
0
$0
1
$127,350
0
$0
0
$0
APPLICATIONS DENIED
0
$0
1
$116,120
8
$83,204
4
$29,722
0
$0
APPLICATIONS WITHDRAWN
0
$0
3
$80,870
4
$100,528
1
$104,720
1
$41,820
FILES CLOSED FOR INCOMPLETENESS
0
$0
0
$0
0
$0
0
$0
0
$0
Aggregated Statistics For Year 2004 (Based on 1 partial tract)
A) FHA, FSA/RHS & VA Home Purchase Loans
B) Conventional Home Purchase Loans
C) Refinancings
D) Home Improvement Loans
F) Non-occupant Loans on < 5 Family Dwellings (A B C & D)
Number
Average Value
Number
Average Value
Number
Average Value
Number
Average Value
Number
Average Value
LOANS ORIGINATED
1
$93,830
10
$92,690
14
$81,229
6
$10,167
1
$139,100
APPLICATIONS APPROVED, NOT ACCEPTED
0
$0
1
$73,270
2
$90,980
0
$0
0
$0
APPLICATIONS DENIED
0
$0
1
$78,970
8
$71,150
2
$7,605
0
$0
APPLICATIONS WITHDRAWN
0
$0
1
$104,370
6
$88,963
1
$13,820
1
$30,070
FILES CLOSED FOR INCOMPLETENESS
0
$0
0
$0
0
$0
0
$0
0
$0
Aggregated Statistics For Year 2003 (Based on 1 partial tract)
A) FHA, FSA/RHS & VA Home Purchase Loans
B) Conventional Home Purchase Loans
C) Refinancings
D) Home Improvement Loans
F) Non-occupant Loans on < 5 Family Dwellings (A B C & D)
Number
Average Value
Number
Average Value
Number
Average Value
Number
Average Value
Number
Average Value
LOANS ORIGINATED
1
$94,180
7
$119,997
28
$82,265
3
$18,087
1
$69,810
APPLICATIONS APPROVED, NOT ACCEPTED
0
$0
1
$85,190
2
$69,550
0
$0
0
$0
APPLICATIONS DENIED
0
$0
1
$35,600
8
$65,578
1
$17,110
1
$39,050
APPLICATIONS WITHDRAWN
0
$0
2
$79,055
5
$73,128
1
$17,280
0
$0
FILES CLOSED FOR INCOMPLETENESS
0
$0
0
$0
2
$53,135
0
$0
0
$0
Aggregated Statistics For Year 2002 (Based on 1 partial tract)
A) FHA, FSA/RHS & VA Home Purchase Loans
B) Conventional Home Purchase Loans
C) Refinancings
D) Home Improvement Loans
F) Non-occupant Loans on < 5 Family Dwellings (A B C & D)
Number
Average Value
Number
Average Value
Number
Average Value
Number
Average Value
Number
Average Value
LOANS ORIGINATED
1
$68,080
6
$109,987
17
$91,635
4
$14,860
1
$84,330
APPLICATIONS APPROVED, NOT ACCEPTED
0
$0
1
$50,800
2
$44,580
0
$0
0
$0
APPLICATIONS DENIED
0
$0
2
$84,065
10
$70,831
1
$15,550
1
$20,220
APPLICATIONS WITHDRAWN
1
$35,770
1
$41,640
4
$72,965
0
$0
1
$27,300
FILES CLOSED FOR INCOMPLETENESS
0
$0
0
$0
2
$64,715
0
$0
0
$0
Aggregated Statistics For Year 2001 (Based on 1 partial tract)
A) FHA, FSA/RHS & VA Home Purchase Loans
B) Conventional Home Purchase Loans
C) Refinancings
D) Home Improvement Loans
F) Non-occupant Loans on < 5 Family Dwellings (A B C & D)
Number
Average Value
Number
Average Value
Number
Average Value
Number
Average Value
Number
Average Value
LOANS ORIGINATED
2
$68,775
7
$102,520
18
$74,582
4
$17,368
1
$82,940
APPLICATIONS APPROVED, NOT ACCEPTED
0
$0
0
$0
1
$69,290
1
$31,280
0
$0
APPLICATIONS DENIED
0
$0
2
$62,380
7
$61,147
2
$8,815
1
$87,260
APPLICATIONS WITHDRAWN
0
$0
1
$116,290
4
$59,572
0
$0
0
$0
FILES CLOSED FOR INCOMPLETENESS
0
$0
0
$0
1
$67,220
0
$0
0
$0
Aggregated Statistics For Year 2000 (Based on 1 partial tract)
A) FHA, FSA/RHS & VA Home Purchase Loans
B) Conventional Home Purchase Loans
C) Refinancings
D) Home Improvement Loans
F) Non-occupant Loans on < 5 Family Dwellings (A B C & D)
Number
Average Value
Number
Average Value
Number
Average Value
Number
Average Value
Number
Average Value
LOANS ORIGINATED
2
$84,065
5
$88,300
7
$59,443
5
$17,072
1
$25,230
APPLICATIONS APPROVED, NOT ACCEPTED
0
$0
1
$29,890
1
$37,670
0
$0
0
$0
APPLICATIONS DENIED
0
$0
1
$51,670
5
$44,858
2
$8,295
0
$0
APPLICATIONS WITHDRAWN
0
$0
1
$59,440
3
$47,577
0
$0
0
$0
FILES CLOSED FOR INCOMPLETENESS
0
$0
0
$0
0
$0
0
$0
0
$0
Aggregated Statistics For Year 1999 (Based on 1 partial tract)
Detailed PMIC statistics for the following Tracts:0202.00
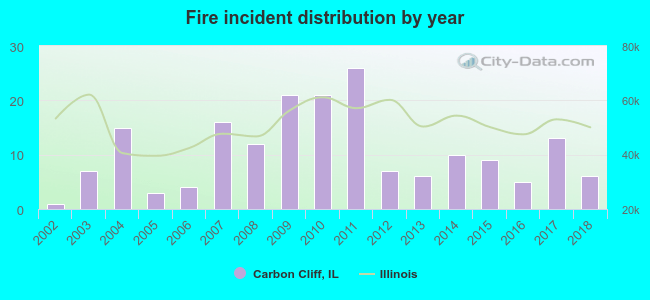
2002 - 2018 National Fire Incident Reporting System (NFIRS) incidents
Based on the data from the years 2002 - 2018 the average number of fires per year is 11. The highest number of fires - 26 took place in 2011, and the least - 1 in 2002. The data has a rising trend.
When looking into fire subcategories, the most incidents belonged to: Structure Fires (41.8%), and Outside Fires (36.8%).
Fire incident types reported to NFIRS in Carbon Cliff, IL


 Recent articles from our blog. Our writers, many of them Ph.D. graduates or candidates, create easy-to-read articles on a wide variety of topics.

 (10.5 miles


 Based on the data from the years 2002 - 2018 the average number of fires per year is 11. The highest number of fires - 26 took place in 2011, and the least - 1 in 2002. The data has a rising trend.
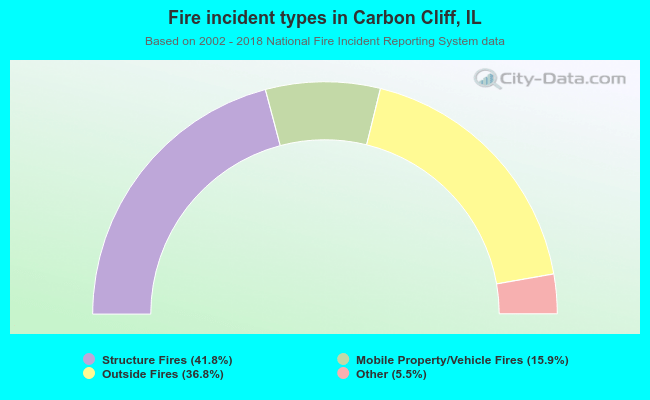 When looking into fire subcategories, the most incidents belonged to: Structure Fires (41.8%), and Outside Fires (36.8%).