According to our research of Louisiana and other state lists, there were 2 registered sex offenders living in Blanchard, Louisiana as of June 07, 2024. The ratio of all residents to sex offenders in Blanchard is 1,461 to 1. The ratio of registered sex offenders to all residents in this city is much lower than the state average.
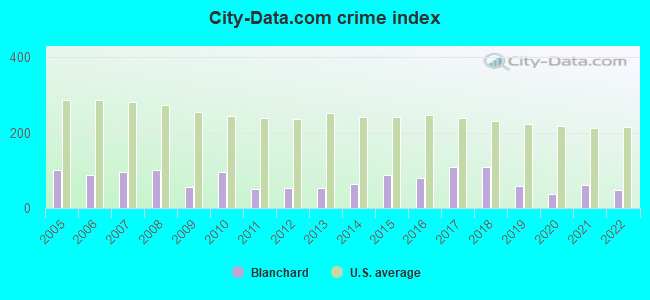
Crime rates in Blanchard by year
Type
2009
2010
2011
2012
2013
2014
2015
2016
2017
2018
2019
2020
2021
2022
Murders (per 100,000)
0 (0.0)
0 (0.0)
0 (0.0)
0 (0.0)
0 (0.0)
0 (0.0)
0 (0.0)
0 (0.0)
0 (0.0)
0 (0.0)
0 (0.0)
0 (0.0)
0 (0.0)
0 (0.0)
Rapes (per 100,000)
0 (0.0)
0 (0.0)
0 (0.0)
0 (0.0)
0 (0.0)
0 (0.0)
0 (0.0)
0 (0.0)
0 (0.0)
0 (0.0)
0 (0.0)
0 (0.0)
0 (0.0)
0 (0.0)
Robberies (per 100,000)
0 (0.0)
0 (0.0)
0 (0.0)
0 (0.0)
0 (0.0)
0 (0.0)
0 (0.0)
2 (68.0)
0 (0.0)
0 (0.0)
0 (0.0)
0 (0.0)
0 (0.0)
1 (29.6)
Assaults (per 100,000)
1 (37.7)
1 (34.5)
1 (34.2)
0 (0.0)
0 (0.0)
2 (69.1)
3 (103.1)
0 (0.0)
0 (0.0)
1 (31.6)
0 (0.0)
0 (0.0)
2 (63.8)
1 (29.6)
Burglaries (per 100,000)
0 (0.0)
14 (482.9)
5 (170.9)
7 (238.2)
5 (171.1)
3 (103.6)
3 (103.1)
11 (374.0)
25 (784.7)
19 (599.7)
6 (190.7)
7 (221.0)
4 (127.5)
2 (59.1)
Thefts (per 100,000)
28 (1,055)
35 (1,207)
21 (717.7)
20 (680.5)
27 (924.0)
27 (932.3)
38 (1,305)
22 (748.0)
34 (1,067)
34 (1,073)
30 (953.3)
17 (536.8)
24 (765.1)
17 (502.5)
Auto thefts (per 100,000)
2 (75.3)
2 (69.0)
1 (34.2)
3 (102.1)
2 (68.4)
2 (69.1)
3 (103.1)
1 (34.0)
4 (125.5)
7 (221.0)
3 (95.3)
0 (0.0)
4 (127.5)
4 (118.2)
Arson (per 100,000)
0 (0.0)
0 (0.0)
0 (0.0)
0 (0.0)
0 (0.0)
0 (0.0)
0 (0.0)
0 (0.0)
0 (0.0)
0 (0.0)
0 (0.0)
0 (0.0)
0 (0.0)
0 (0.0)
City-Data.com crime index
55.7
94.5
50.2
52.1
54.4
63.9
88.3
79.2
107.7
108.9
59.1
36.9
62.5
48.5
The City-Data.com crime index weighs serious crimes and violent crimes more heavily. Higher means more crime, U.S. average is 246.1. It adjusts for the number of visitors and daily workers commuting into cities.
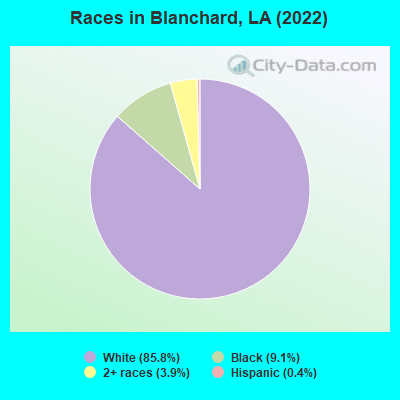
Ancestries: American (18.2%), German (13.2%), Irish (13.1%), Scottish (10.2%), English (6.4%), Scotch-Irish (2.8%).
Current Local Time: CST time zone
Elevation: 240 feet
Land area: 2.41 square miles.
Population density: 1,416 people per square mile (low).
8 residents are foreign born
This town:
0.2%
Louisiana:
4.2%
Median real estate property taxes paid for housing units with mortgages in 2022: $1,709 (0.9%) Median real estate property taxes paid for housing units with no mortgage in 2022: $2,188 (1.7%)
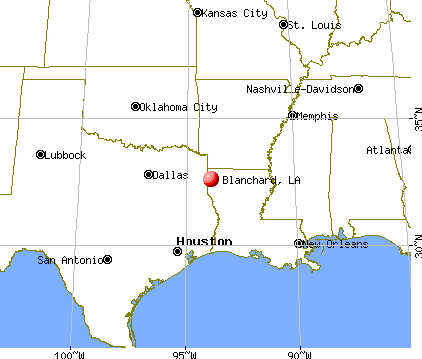
Nearest city with pop. 50,000+: Shreveport, LA (10.7 miles , pop. 200,145).
Nearest city with pop. 1,000,000+: Dallas, TX (169.4 miles , pop. 1,188,580).
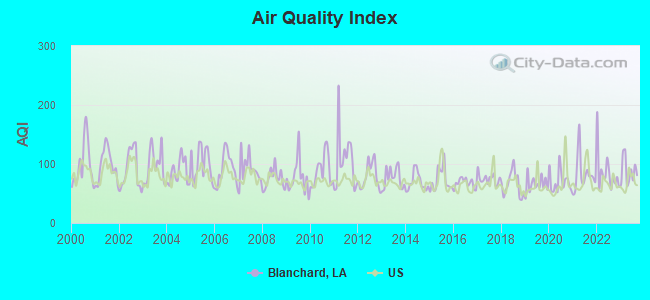
Air Quality Index (AQI) level in 2023 was 87.8. This is worse than average.
City:
87.8
U.S.:
72.6
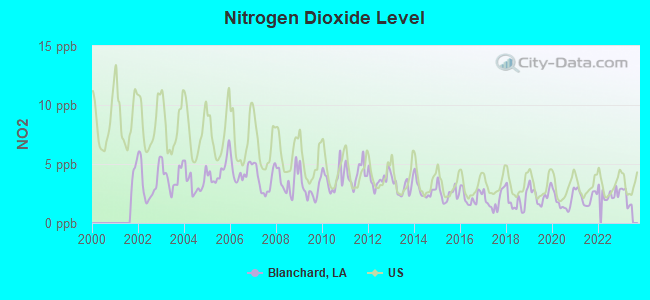
Nitrogen Dioxide (NO2) [ppb] level in 2022 was 2.48. This is significantly better than average.Closest monitor was 8.8 miles away from the city center.
City:
2.48
U.S.:
5.11
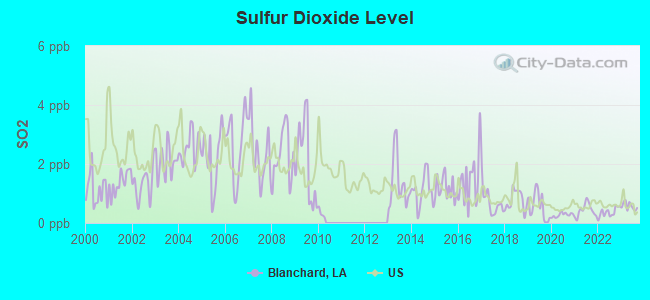
Sulfur Dioxide (SO2) [ppb] level in 2023 was 0.570. This is significantly better than average.Closest monitor was 8.9 miles away from the city center.
City:
0.570
U.S.:
1.515
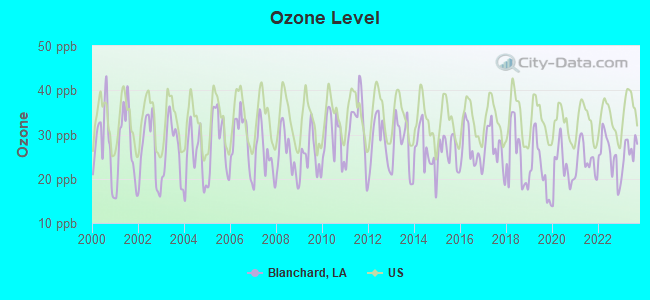
Ozone [ppb] level in 2023 was 26.3. This is better than average.Closest monitor was 8.8 miles away from the city center.
City:
26.3
U.S.:
33.3
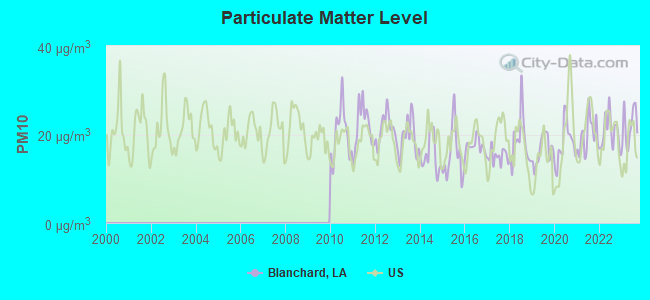
Particulate Matter (PM10) [µg/m3] level in 2023 was 21.8. This is about average.Closest monitor was 8.9 miles away from the city center.
City:
21.8
U.S.:
19.2
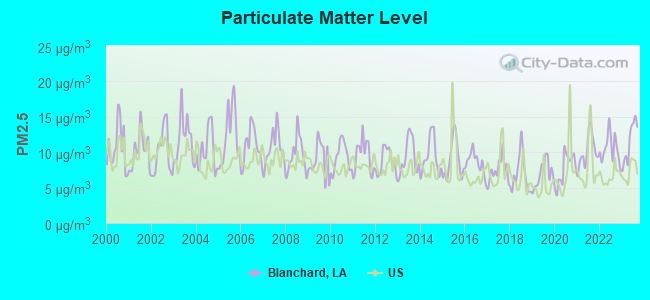
Particulate Matter (PM2.5) [µg/m3] level in 2023 was 11.4. This is significantly worse than average.Closest monitor was 17.3 miles away from the city center.
City:
11.4
U.S.:
8.1
Tornado activity:
Blanchard-area historical tornado activity is above Louisiana state average. It is 131% greater than the overall U.S. average.
On 4/3/1999, a category F4 (max. wind speeds 207-260 mph) tornado 5.2 miles away from the Blanchard town center killed 7 peopleand injured 102 peopleand caused $8 million in damages.
On 12/3/1978, a category F4 tornado 10.0 miles away from the town center killed 2 peopleand injured 266 peopleand causedbetween $50,000,000 and $500,000,000 in damages.
Earthquake activity:
Blanchard-area historical earthquake activity is significantly above Louisiana state average. It is 364% greater than the overall U.S. average.
On 5/17/2012 at 08:12:00, a magnitude 4.8 (4.8 MW, Depth: 3.1 mi, Class: Light, Intensity: IV - V) earthquake occurred 53.7 miles away from the city center On 11/6/2011 at 03:53:10, a magnitude 5.7 (5.7 MW, Depth: 3.2 mi, Class: Moderate, Intensity: VI - VII) earthquake occurred 262.0 miles away from the city center On 9/3/2016 at 12:02:44, a magnitude 5.8 (5.8 MW, Depth: 3.5 mi) earthquake occurred 317.0 miles away from Blanchard center On 9/2/2013 at 23:51:15, a magnitude 4.3 (4.3 MW, Depth: 2.9 mi) earthquake occurred 56.5 miles away from Blanchard center On 9/2/2013 at 21:52:38, a magnitude 4.2 (4.2 MW, Depth: 3.0 mi) earthquake occurred 56.9 miles away from Blanchard center On 1/25/2013 at 07:01:19, a magnitude 4.1 (4.1 MB, Depth: 3.1 mi) earthquake occurred 56.8 miles away from Blanchard center Magnitude types: body-wave magnitude (MB), moment magnitude (MW)
Natural disasters:
The number of natural disasters in Caddo Parish (18) is near the US average (15). Major Disasters (Presidential) Declared: 12 Emergencies Declared: 4
Causes of natural disasters: Floods: 7, Storms: 7, Hurricanes: 6, Tornadoes: 3, Winter Storms: 2, Drought: 1, Freeze: 1, Ice Storm: 1, Other: 2 (Note: some incidents may be assigned to more than one category).
Hospitals and medical centers near Blanchard:
HMC HOSPICE CARE (Hospital, about 1 miles away; SHREVEPORT, LA)
YUKON COMMUNITY HOME (Hospital, about 3 miles away; SHREVEPORT, LA)
OLD MOORINGSPORT COMMUNITY HOM (Hospital, about 7 miles away; SHREVEPORT, LA)
JEFFERSON PAIGE COMMUNITY HOME (Hospital, about 8 miles away; SHREVEPORT, LA)
FMCNA - NORTH SHREVEPORT DIALYSIS (Dialysis Facility, about 8 miles away; SHREVEPORT, LA)
DCI - NORTH SHREVEPORT (Dialysis Facility, about 8 miles away; SHREVEPORT, LA)
BARONNE COMMUNITY HOME (Hospital, about 9 miles away; SHREVEPORT, LA)
10 miles: SHREVEPORT (102 LAKE ST.) - Bus Station . Services: fully wheelchair accessible, public payphones, free short-term parking, call for taxi service.
13 miles: BOSSIER CITY (3033 HILTON DR.) - Bus Station . Services: fully wheelchair accessible, enclosed waiting area, public restrooms, public payphones, full-service food facilities, free short-term parking, free long-term parking, call for taxi service.
Colleges/universities with over 2000 students nearest to Blanchard:
Southern University at Shreveport (about 5 miles; Shreveport, LA; Full-time enrollment: 2,277)
Bossier Parish Community College (about 15 miles; Bossier City, LA; FT enrollment: 6,209)
Louisiana State University-Shreveport (about 16 miles; Shreveport, LA; FT enrollment: 3,159)
LeTourneau University (about 50 miles; Longview, TX; FT enrollment: 2,357)
Kilgore College (about 60 miles; Kilgore, TX; FT enrollment: 3,127)
Texarkana College (about 61 miles; Texarkana, TX; FT enrollment: 2,629)
Southern Arkansas University Main Campus (about 62 miles; Magnolia, AR; FT enrollment: 3,005)
Caddo Parish has a predicted average indoor radon screening level less than 2 pCi/L (pico curies per liter) - Low Potential
Drinking water stations with addresses in Blanchard and their reported violations in the past:
BLANCHARD WATER SYSTEM (Population served: 12,195, Surface water):
Past monitoring violations:
Monthly Turbidity Exceed (Enhanced SWTR) - In FEB-2007, Contaminant: IESWTR. Follow-up actions: St Public Notif requested (MAR-16-2007), St Violation/Reminder Notice (MAR-16-2007), St Compliance achieved (MAR-30-2007)
Monthly Turbidity Exceed (Enhanced SWTR) - In JAN-2007, Contaminant: IESWTR. Follow-up actions: St Public Notif requested (MAR-16-2007), St Violation/Reminder Notice (MAR-16-2007), St Compliance achieved (MAR-30-2007)
Monitoring and Reporting (DBP) - In JAN-01-2002, Contaminant: DBP Stage 1
Average household size:
This town:
2.5 people
Louisiana:
2.5 people
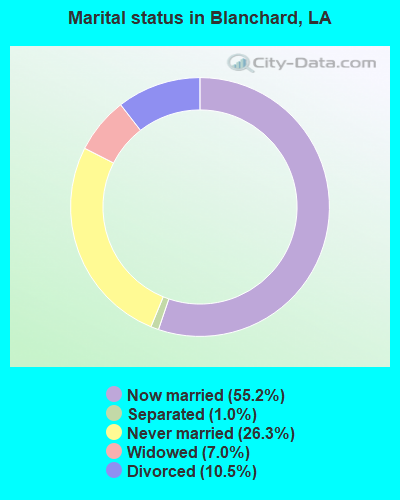
Percentage of family households:
This town:
73.3%
Whole state:
67.1%
Percentage of households with unmarried partners:
This town:
5.2%
Whole state:
6.8%
Likely homosexual households (counted as self-reported same-sex unmarried-partner households)
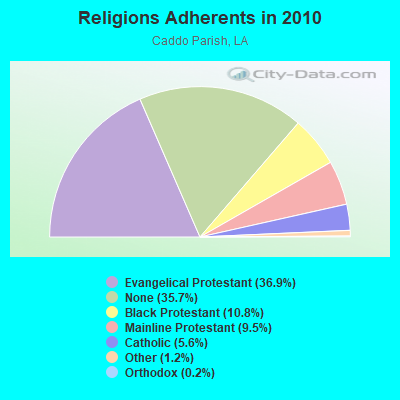
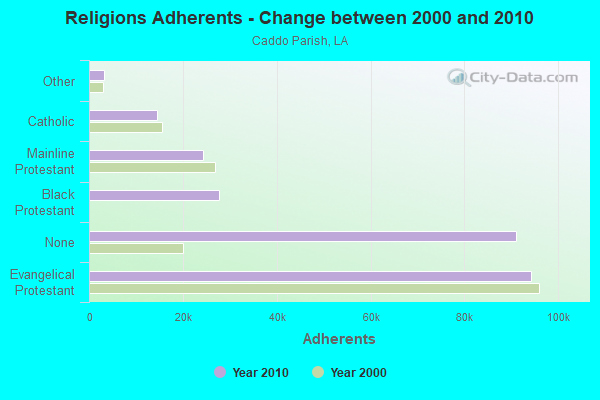
Religion statistics for Blanchard, LA (based on Caddo Parish data)
Religion
Adherents
Congregations
Evangelical Protestant
94,174
166
Black Protestant
27,644
78
Mainline Protestant
24,233
45
Catholic
14,397
10
Other
3,110
14
Orthodox
445
3
None
90,966
-
Source: Clifford Grammich, Kirk Hadaway, Richard Houseal, Dale E.Jones, Alexei Krindatch, Richie Stanley and Richard H.Taylor. 2012. 2010 U.S.Religion Census: Religious Congregations & Membership Study. Association of Statisticians of American Religious Bodies. Jones, Dale E., et al. 2002. Congregations and Membership in the United States 2000. Nashville, TN: Glenmary Research Center. Graphs represent county-level data
STATION, Texas Junction 0.7 Mi Se Of (Lat: 32.572917 Lon: -93.883500), Overall height: 18.3 m, Call Sign: KNR23, Assigned Frequencies: 955.900 MHz, Grant Date: 06/19/2001, Expiration Date: 08/22/2011, Cancellation Date: 05/31/2011, Registrant: The Kansas City Southern Railway Company, 4601 Hilry Huckaby Dr., Shreveport, LA 71107-5797, Phone: (318) 676-6188, Fax: (318) 676-6252, Email:
STATION, Hammock On L&a Right Of Way 4 Miles West Of (Lat: 32.587917 Lon: -93.955444), Overall height: 30.5 m, Call Sign: WHJ319, Assigned Frequencies: 954.250 MHz, Grant Date: 07/29/1998, Expiration Date: 10/08/2008, Cancellation Date: 10/06/2008, Phone: (318) 227-7148
FCC Registered Paging Towers:
1
Old Mooringsport Road 2 Miles Ne Of (Lat: 32.604028 Lon: -93.871000), Call Sign: KKQ962, Licensee ID: L00128636, Assigned Frequencies: 152.090 MHz, Grant Date: 04/27/1999, Expiration Date: 04/01/2009, Cancellation Date: 01/21/2012, Registrant: Southern Message Service, Inc., 709 Crockett Street, Shreveport, LA 71101
FCC Registered Amateur Radio Licenses:
7
Call Sign: KB5NKI, Licensee ID: L00231159, Grant Date: 04/22/2000, Expiration Date: 07/17/2010, Cancellation Date: 07/18/2012, Registrant: Jeffrey B Mathews, Blanchard, LA 71109
Call Sign: KC5FLL, Licensee ID: L00211410, Grant Date: 01/19/2024, Expiration Date: 02/15/2034, Certifier: John W Kreymer, Registrant: John W Kreymer, Blanchard, LA 71009-1322
Call Sign: N5HKT, Grant Date: 08/05/1996, Expiration Date: 08/05/2006, Cancellation Date: 08/06/2008, Registrant: Joel E Wharton Sr, Blanchard, LA 71009
Call Sign: W5KDF, Licensee ID: L00853414, Grant Date: 04/26/2004, Expiration Date: 07/13/2014, Cancellation Date: 07/14/2016, Certifier: Charles L Matthews, Registrant: Charles L Matthews, Blanchard, LA 71009
Call Sign: WA5EKS, Licensee ID: L00814339, Grant Date: 01/15/1998, Expiration Date: 01/15/2008, Cancellation Date: 03/06/2004, Registrant: Charles C Dockery, Box 385, Blanchard, LA 71009
Call Sign: W5LAX, Previous Call Sign: WA5EKS, Licensee ID: L00814339, Grant Date: 01/19/2024, Expiration Date: 03/06/2034, Certifier: Charles C Dockery, Registrant: Charles C Dockery, 628 Sandra, Blanchard, LA 71009-0385
Call Sign: KI5GYO, Licensee ID: L02302196, Grant Date: 10/29/2019, Expiration Date: 10/29/2029, Certifier: Robert Gray Ii, Registrant: Robert Gray Ii, Blanchard, LA 71009
Home Mortgage Disclosure Act Aggregated Statistics For Year 2009 (Based on 1 partial tract)
A) FHA, FSA/RHS & VA Home Purchase Loans
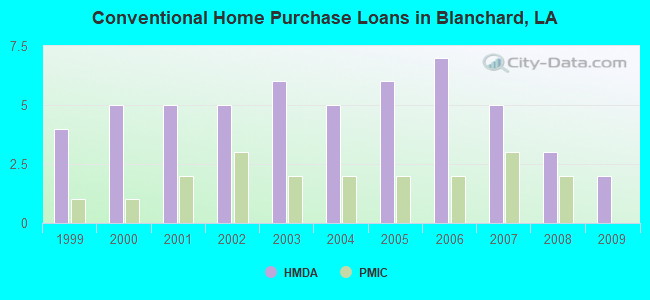
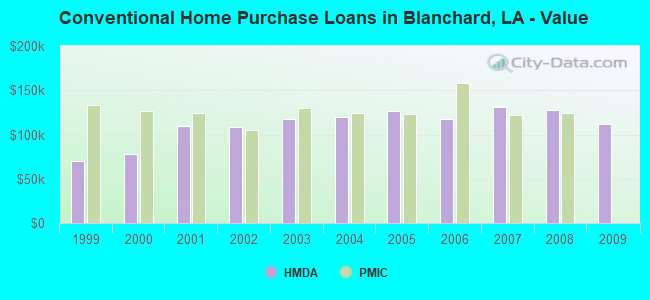
B) Conventional Home Purchase Loans
C) Refinancings
D) Home Improvement Loans
F) Non-occupant Loans on < 5 Family Dwellings (A B C & D)
G) Loans On Manufactured Home Dwelling (A B C & D)
Number
Average Value
Number
Average Value
Number
Average Value
Number
Average Value
Number
Average Value
Number
Average Value
LOANS ORIGINATED
4
$150,835
2
$111,525
7
$145,694
1
$26,670
1
$53,250
1
$91,370
APPLICATIONS APPROVED, NOT ACCEPTED
0
$0
0
$0
1
$71,540
0
$0
0
$0
0
$0
APPLICATIONS DENIED
1
$121,200
0
$0
4
$131,252
1
$18,530
0
$0
1
$46,410
APPLICATIONS WITHDRAWN
0
$0
0
$0
2
$140,385
0
$0
0
$0
0
$0
FILES CLOSED FOR INCOMPLETENESS
0
$0
0
$0
0
$0
0
$0
0
$0
0
$0
Aggregated Statistics For Year 2008 (Based on 1 partial tract)
A) FHA, FSA/RHS & VA Home Purchase Loans
B) Conventional Home Purchase Loans
C) Refinancings
D) Home Improvement Loans
F) Non-occupant Loans on < 5 Family Dwellings (A B C & D)
G) Loans On Manufactured Home Dwelling (A B C & D)
Number
Average Value
Number
Average Value
Number
Average Value
Number
Average Value
Number
Average Value
Number
Average Value
LOANS ORIGINATED
2
$140,625
3
$128,200
4
$178,905
1
$49,760
1
$85,460
1
$100,540
APPLICATIONS APPROVED, NOT ACCEPTED
0
$0
0
$0
1
$110,680
0
$0
0
$0
0
$0
APPLICATIONS DENIED
1
$92,880
1
$89,430
5
$119,212
1
$52,230
0
$0
1
$94,620
APPLICATIONS WITHDRAWN
0
$0
0
$0
2
$135,895
0
$0
0
$0
0
$0
FILES CLOSED FOR INCOMPLETENESS
0
$0
0
$0
0
$0
0
$0
0
$0
0
$0
Aggregated Statistics For Year 2007 (Based on 1 partial tract)
A) FHA, FSA/RHS & VA Home Purchase Loans
B) Conventional Home Purchase Loans
C) Refinancings
D) Home Improvement Loans
G) Loans On Manufactured Home Dwelling (A B C & D)
Number
Average Value
Number
Average Value
Number
Average Value
Number
Average Value
Number
Average Value
LOANS ORIGINATED
2
$115,165
5
$131,164
5
$134,530
2
$28,665
1
$93,900
APPLICATIONS APPROVED, NOT ACCEPTED
0
$0
1
$102,140
1
$116,550
0
$0
0
$0
APPLICATIONS DENIED
0
$0
1
$102,430
5
$127,836
1
$72,360
1
$57,330
APPLICATIONS WITHDRAWN
0
$0
1
$64,750
2
$105,925
0
$0
0
$0
FILES CLOSED FOR INCOMPLETENESS
0
$0
0
$0
1
$98,020
0
$0
0
$0
Aggregated Statistics For Year 2006 (Based on 1 partial tract)
A) FHA, FSA/RHS & VA Home Purchase Loans
B) Conventional Home Purchase Loans
C) Refinancings
D) Home Improvement Loans
F) Non-occupant Loans on < 5 Family Dwellings (A B C & D)
G) Loans On Manufactured Home Dwelling (A B C & D)
Number
Average Value
Number
Average Value
Number
Average Value
Number
Average Value
Number
Average Value
Number
Average Value
LOANS ORIGINATED
1
$137,450
7
$117,066
5
$124,130
2
$39,115
1
$102,720
2
$64,940
APPLICATIONS APPROVED, NOT ACCEPTED
0
$0
1
$91,620
2
$116,790
0
$0
0
$0
0
$0
APPLICATIONS DENIED
0
$0
2
$95,110
6
$113,822
1
$24,880
0
$0
1
$71,730
APPLICATIONS WITHDRAWN
0
$0
1
$143,170
2
$128,115
0
$0
0
$0
0
$0
FILES CLOSED FOR INCOMPLETENESS
0
$0
0
$0
1
$223,830
0
$0
0
$0
0
$0
Aggregated Statistics For Year 2005 (Based on 1 partial tract)
A) FHA, FSA/RHS & VA Home Purchase Loans
B) Conventional Home Purchase Loans
C) Refinancings
D) Home Improvement Loans
F) Non-occupant Loans on < 5 Family Dwellings (A B C & D)
G) Loans On Manufactured Home Dwelling (A B C & D)
Number
Average Value
Number
Average Value
Number
Average Value
Number
Average Value
Number
Average Value
Number
Average Value
LOANS ORIGINATED
2
$95,230
6
$126,665
9
$116,313
1
$51,650
1
$58,490
2
$51,410
APPLICATIONS APPROVED, NOT ACCEPTED
0
$0
1
$126,780
2
$92,900
1
$15,570
0
$0
0
$0
APPLICATIONS DENIED
0
$0
2
$93,995
8
$106,785
1
$42,340
0
$0
2
$50,585
APPLICATIONS WITHDRAWN
0
$0
1
$101,460
5
$139,728
0
$0
0
$0
0
$0
FILES CLOSED FOR INCOMPLETENESS
0
$0
0
$0
2
$90,330
0
$0
0
$0
0
$0
Aggregated Statistics For Year 2004 (Based on 1 partial tract)
A) FHA, FSA/RHS & VA Home Purchase Loans
B) Conventional Home Purchase Loans
C) Refinancings
D) Home Improvement Loans
F) Non-occupant Loans on < 5 Family Dwellings (A B C & D)
G) Loans On Manufactured Home Dwelling (A B C & D)
Number
Average Value
Number
Average Value
Number
Average Value
Number
Average Value
Number
Average Value
Number
Average Value
LOANS ORIGINATED
2
$88,320
5
$120,338
8
$107,094
1
$21,490
1
$45,740
1
$77,550
APPLICATIONS APPROVED, NOT ACCEPTED
0
$0
1
$106,310
2
$105,365
0
$0
0
$0
0
$0
APPLICATIONS DENIED
0
$0
2
$65,280
6
$91,867
1
$40,840
0
$0
2
$49,955
APPLICATIONS WITHDRAWN
0
$0
1
$53,400
5
$100,056
0
$0
0
$0
0
$0
FILES CLOSED FOR INCOMPLETENESS
0
$0
0
$0
1
$85,700
0
$0
0
$0
0
$0
Aggregated Statistics For Year 2003 (Based on 1 partial tract)
A) FHA, FSA/RHS & VA Home Purchase Loans
B) Conventional Home Purchase Loans
C) Refinancings
D) Home Improvement Loans
F) Non-occupant Loans on < 5 Family Dwellings (A B C & D)
Number
Average Value
Number
Average Value
Number
Average Value
Number
Average Value
Number
Average Value
LOANS ORIGINATED
2
$78,860
6
$117,645
15
$116,077
1
$38,120
1
$62,560
APPLICATIONS APPROVED, NOT ACCEPTED
0
$0
1
$101,610
3
$92,360
0
$0
0
$0
APPLICATIONS DENIED
0
$0
1
$43,550
5
$91,432
1
$28,130
0
$0
APPLICATIONS WITHDRAWN
0
$0
1
$73,820
3
$102,803
0
$0
0
$0
FILES CLOSED FOR INCOMPLETENESS
0
$0
0
$0
0
$0
0
$0
0
$0
Aggregated Statistics For Year 2002 (Based on 1 partial tract)
A) FHA, FSA/RHS & VA Home Purchase Loans
B) Conventional Home Purchase Loans
C) Refinancings
D) Home Improvement Loans
F) Non-occupant Loans on < 5 Family Dwellings (A B C & D)
Number
Average Value
Number
Average Value
Number
Average Value
Number
Average Value
Number
Average Value
LOANS ORIGINATED
2
$72,460
5
$108,756
11
$103,561
2
$25,460
1
$36,230
APPLICATIONS APPROVED, NOT ACCEPTED
0
$0
1
$77,110
2
$64,260
0
$0
0
$0
APPLICATIONS DENIED
0
$0
2
$73,865
4
$59,110
2
$20,735
0
$0
APPLICATIONS WITHDRAWN
0
$0
0
$0
2
$116,810
0
$0
0
$0
FILES CLOSED FOR INCOMPLETENESS
0
$0
0
$0
1
$47,580
0
$0
0
$0
Aggregated Statistics For Year 2001 (Based on 1 partial tract)
A) FHA, FSA/RHS & VA Home Purchase Loans
B) Conventional Home Purchase Loans
C) Refinancings
D) Home Improvement Loans
F) Non-occupant Loans on < 5 Family Dwellings (A B C & D)
Number
Average Value
Number
Average Value
Number
Average Value
Number
Average Value
Number
Average Value
LOANS ORIGINATED
2
$69,090
5
$109,872
9
$101,360
2
$35,745
1
$33,220
APPLICATIONS APPROVED, NOT ACCEPTED
0
$0
1
$77,020
2
$81,480
0
$0
0
$0
APPLICATIONS DENIED
0
$0
2
$67,440
4
$73,392
1
$16,970
0
$0
APPLICATIONS WITHDRAWN
0
$0
1
$39,820
3
$78,037
0
$0
0
$0
FILES CLOSED FOR INCOMPLETENESS
0
$0
0
$0
1
$41,370
0
$0
0
$0
Aggregated Statistics For Year 2000 (Based on 1 partial tract)
A) FHA, FSA/RHS & VA Home Purchase Loans
B) Conventional Home Purchase Loans
C) Refinancings
D) Home Improvement Loans
Number
Average Value
Number
Average Value
Number
Average Value
Number
Average Value
LOANS ORIGINATED
2
$69,430
5
$77,852
3
$73,347
1
$27,980
APPLICATIONS APPROVED, NOT ACCEPTED
0
$0
1
$48,980
1
$74,160
1
$17,410
APPLICATIONS DENIED
0
$0
2
$76,145
4
$50,440
2
$8,390
APPLICATIONS WITHDRAWN
0
$0
1
$50,290
2
$61,400
0
$0
FILES CLOSED FOR INCOMPLETENESS
0
$0
0
$0
0
$0
0
$0
Aggregated Statistics For Year 1999 (Based on 1 partial tract)
Detailed PMIC statistics for the following Tracts:0245.02
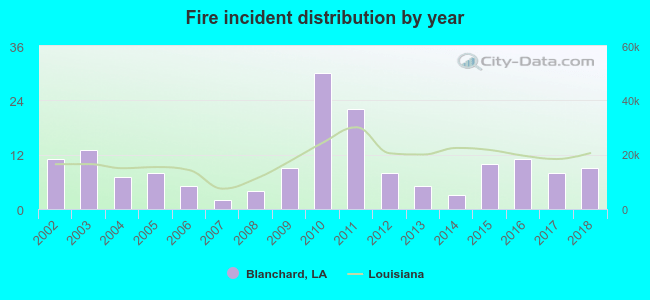
2002 - 2018 National Fire Incident Reporting System (NFIRS) incidents
Based on the data from the years 2002 - 2018 the average number of fires per year is 10. The highest number of reported fires - 30 took place in 2010, and the least - 2 in 2007. The data has a decreasing trend.
When looking into fire subcategories, the most incidents belonged to: Structure Fires (46.1%), and Outside Fires (37.6%).
Fire incident types reported to NFIRS in Blanchard, LA


 Recent articles from our blog. Our writers, many of them Ph.D. graduates or candidates, create easy-to-read articles on a wide variety of topics.

 (10.7 miles


 Based on the data from the years 2002 - 2018 the average number of fires per year is 10. The highest number of reported fires - 30 took place in 2010, and the least - 2 in 2007. The data has a decreasing trend.
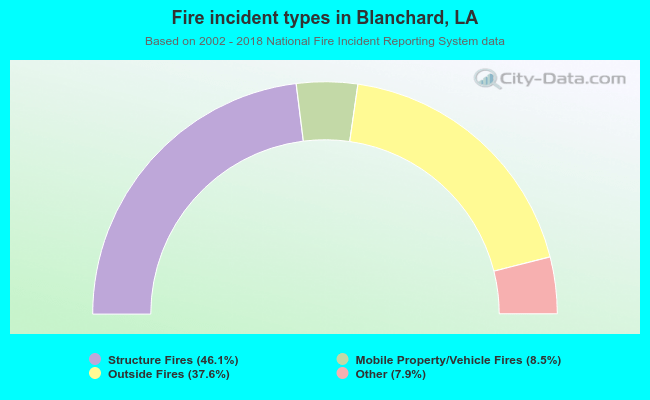 When looking into fire subcategories, the most incidents belonged to: Structure Fires (46.1%), and Outside Fires (37.6%).